Concept explainers
Videos
(a)
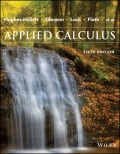
Plot the data and the regression line on the same axes. Does the line fit the data well?
(a)
Answer to Problem 1P
Yes, the line fits the data well
Explanation of Solution
Given information:
Table gives the gross world product, G, which measures output of goods and services. If t is in years since 1950, the regression line these data is
G in tillions of 1999 dollars.
| Year | 1950 | 1960 | 1970 | 1980 | 1990 | 2000 |
| G | 6.4 | 10.0 | 16.3 | 23.6 | 31.9 | 43.2 |
Calculation:
Yes, the line fits the data well (is in fact the linear regression line) with
(b)
Interpret the slope of the line in terms of gross world product.
(b)
Explanation of Solution
The gross world product, G, which measures global output of goods and services is given by
Hence, the slope of G ( t ) indicates that gross world product increases by 0.734 trillion dollars every year.
(c)
Use the regression line to estimate gross world product in 2005 and in 2020. Comment on your confidence in the two predictions.
(c)
Answer to Problem 1P
The gross world product in 2005 = 1475.213 trillion dollars
The gross world product in 2020 = 1486.223 trillion dollars
Both predictions cannot be made confidently.
Explanation of Solution
Given information:
Table A.5 gives the gross world product, G, which measures output of goods and services. If t is in years since 1950, the regression line these data is
| Year | 1950 | 1960 | 1970 | 1980 | 1990 | 2000 |
| G | 6.4 | 10.0 | 16.3 | 23.6 | 31.9 | 43.2 |
Calculation:
The gross world product, G, which measures global output of goods and services is given by
Both predictions cannot be made confidently because:
- Uniform increase in gross world product every year is highly unlikely in actual scenario.
- A recession (for example the one in 2009) can also lead to decrease in gross world product.
Thus, the gross world product in 2005 = 1475.213 trillion dollars
The gross world product in 2020 = 1486.223 trillion dollars
Both predictions cannot be made confidently.
Want to see more full solutions like this?
Chapter A Solutions
EBK APPLIED CALCULUS, ENHANCED ETEXT


- Life Expectancy The following table shows the average life expectancy, in years, of a child born in the given year42 Life expectancy 2005 77.6 2007 78.1 2009 78.5 2011 78.7 2013 78.8 a. Find the equation of the regression line, and explain the meaning of its slope. b. Plot the data points and the regression line. c. Explain in practical terms the meaning of the slope of the regression line. d. Based on the trend of the regression line, what do you predict as the life expectancy of a child born in 2019? e. Based on the trend of the regression line, what do you predict as the life expectancy of a child born in 1580?2300arrow_forwardDoes Table 1 represent a linear function? If so, finda linear equation that models the data.arrow_forwardFind the equation of the regression line for the following data set. x 1 2 3 y 0 3 4arrow_forward
 Functions and Change: A Modeling Approach to Coll...AlgebraISBN:9781337111348Author:Bruce Crauder, Benny Evans, Alan NoellPublisher:Cengage Learning
 Glencoe Algebra 1, Student Edition, 9780079039897...AlgebraISBN:9780079039897Author:CarterPublisher:McGraw Hill
 Calculus For The Life SciencesCalculusISBN:9780321964038Author:GREENWELL, Raymond N., RITCHEY, Nathan P., Lial, Margaret L.Publisher:Pearson Addison Wesley,
 Algebra & Trigonometry with Analytic GeometryAlgebraISBN:9781133382119Author:SwokowskiPublisher:Cengage