
Videos
Match the data series from the options shown on the graph to the following model types. You may assume that power and exponential models do not have a constant offset. You may also assume that only positive values are shown on the two axes. For each match, write “Series X.” where X is the appropriate letter, A through F. If no curve matches the specified criterion, write “No Match.” If more than one curve matches a given specification, list both series.
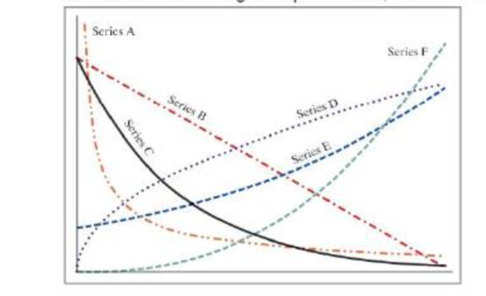
- a. Exponential, negative numeric value in exponent
- b. Power, negative numeric value in exponent
- c. Linear, negative slope
- d. Exponential, positive numeric value in exponent
- e. Power, positive numeric value in exponent
Want to see the full answer?
Check out a sample textbook solution
Chapter 12 Solutions
Thinking Like an Engineer: An Active Learning Approach (4th Edition)
Additional Engineering Textbook Solutions
DESIGN OF MACHINERY
DeGarmo's Materials and Processes in Manufacturing
Thermodynamics: An Engineering Approach
Engineering Mechanics: Statics
Vector Mechanics for Engineers: Statics and Dynamics
Vector Mechanics for Engineers: Statics


- In your biomechanical testing lab, you perform a series of compression tests to determine the relationship between apparent bone density (p, units of g/cm³) and ultimate stress (ơult, units of MPa). Using the set of experimental measurements below, write an m-file to fit a power relationship of the form O uli = Ap to the data. Use the log transform method to linearize the system and data, followed by linear regression. Plot the data points and the power relationship on a single plot. Be sure to label your axes and provide a legend. Provide a printout of your m-file and a printout of the command window showing your results. Write down the best fit equation and box it. 8.76 5.25 4.26 5.51 3.88 18.45 2.09 13.72 5.42 2.17 Oult (MPa) p (g/cm³) 0.598 | 0.459 0.319 | 0.235 0.141 0.754 0.177 0.553 0.394 0.246arrow_forwardFor all the following problems, a) b) 4. You need to show at least 3 iterations calculated manually with all steps. You do not need to include the M.files for the bisection method (bisect.m) and for false position (falspos.m). You must, however, show the command lines for the given functions with their variables and other parameters. Zero-pressure specific heat of dry air Mechanical engineers, as well as most other engineers, use thermodynamics extensively in their work. The following polynomial can be used to relate the zero-pressure specific heat of dry air cp kJ/(kg K) to temperature (K): 11 0.99403 +1.671×10⁻⁴T + 9.7215-10-8T²-9.5838×10- Cp = T3+1.9520×10⁻¹⁴T4 (a) Develop a plot of cp versus a range of T=0 to 1200 K. (b) Use bisection to determine the temperature T that corresponds to a specific heat of 1.1 kJ/(kg K). (c) What will be the value of T if you use false position method? (d) What is the percentage error between the results of (b) and (c)? For both methods use maximum…arrow_forwardUsing the Creo parametric sketch the following: GIVEN - PICTORIAL VIEW DRAW- THE ORTHOGRAPHIC VIEW 80 50 10 R 20 2 HOLES, DIA 10 R 50 $ 40 25 R 30 TR 15 65 30,arrow_forward
- The number line below shows a value on a log scale. 10-5 10 103 102 10-1 100 101 10² 103 104 105 What is, approximately, the value of the point shown on the number line? x = Question Help: D Video D Post to forum Submit Question arch 米 11 144 14 24 41 %23 & 3 T Y K 01 96 近 R EIarrow_forwardConsider the following data with reference to elementary deterministic economic order quantity model Annual demand of an item 100000 Unit price of the item (in Rs.) 10 Inventory carrying cost per unit per year (in Rs.) 1.5 Unit order cost (in Rs.) 30 The total number of economic orders per year to meet the annual demand isarrow_forward88|| 5:08 docs.google.com/for 3 Your answer Draw the orthogonal projections of the Isometric shown in the figure below. 52 20 26 TRUE R16 12 180 1 Add file Submit Never submit passwords through Google Forms. This form was created inside of University of Baghdad. Report Abuse 001 Il>arrow_forward
- I tried 33.7oC and also 50.517oC but it still says it is incorrect (view attached screenshot). I appreciate your efforts, but unfortunately it says it is still wrong. Any more ideas of what the correct answer might be? I really want to understand how to solve this problem correctly. Thank you!arrow_forwardWhat is the answer? Use a given, required, solution format. Show your complete handwritten solution and provide FBD. Solve this step by step. simplify your answer and use the units.arrow_forwardSketch the isometric view using 3D autoCAD ,Attach the file. Ø 2.90 R 3.10 2.50 9.00 1.40 .50 .20 -.20 R.70 の1.25 ROUNDS & FILLETS R .06 -HEX 2.40 ACROSS FLATS -HEX 2.10 ACROSS FLATSarrow_forward
- Make this graph, everything in the same place with the same orange and blue dots along with the line that has the same color along with the same labels, make it in MATLAB and make sure it runs with no errors and please send code I need help, make everything 100% exactly the same, take as long as you need to make the exact graph.arrow_forwardYou are a biomedical engineer working for a small orthopaedic firm that fabricates rectangular shaped fracture fixation plates from titanium alloy (model = "Ti Fix-It") materials. A recent clinical report documents some problems with the plates implanted into fractured limbs. Specifically, some plates have become permanently bent while patients are in rehab and doing partial weight bearing activities. Your boss asks you to review the technical report that was generated by the previous test engineer (whose job you now have!) and used to verify the design. The brief report states the following... "Ti Fix-It plates were manufactured from Ti-6Al-4V (grade 5) and machined into solid 150 mm long beams with a 4 mm thick and 15 mm wide cross section. Each Ti Fix-It plate was loaded in equilibrium in a 4-point bending test (set-up configuration is provided in drawing below), with an applied load of 1000N. The maximum stress in this set-up was less than the yield stress for the Ti-6Al-4V…arrow_forwardIn a study analyzed by the Statistics Consulting Center at Mutah University, a group of subjects was asked to complete a certain task on the computer. The response measured was the time to completion. The purpose of the experiment was to test a set of facilitation tools developed by the Department of Computer Science at the university. There were 10 subjects involved. With a random assignment, five were given a standard procedure using Fortran language for completion of the task. The other five were asked to do the task with the use of the facilitation tools. The data on the completion times for the task are given here. Group 1 Group 2 (Standard Procedure) (Facilitation Tool) 161 169 174 158 163 132 162 134 138 133 Assuming that the population distributions are normal and variances are the same for the two groups, support or refute the conjecture that the facilitation tools increase the speed with which the task can be accomplished.arrow_forward
 Elements Of ElectromagneticsMechanical EngineeringISBN:9780190698614Author:Sadiku, Matthew N. O.Publisher:Oxford University Press
 Mechanics of Materials (10th Edition)Mechanical EngineeringISBN:9780134319650Author:Russell C. HibbelerPublisher:PEARSON
 Thermodynamics: An Engineering ApproachMechanical EngineeringISBN:9781259822674Author:Yunus A. Cengel Dr., Michael A. BolesPublisher:McGraw-Hill Education
 Control Systems EngineeringMechanical EngineeringISBN:9781118170519Author:Norman S. NisePublisher:WILEY
 Mechanics of Materials (MindTap Course List)Mechanical EngineeringISBN:9781337093347Author:Barry J. Goodno, James M. GerePublisher:Cengage Learning
 Engineering Mechanics: StaticsMechanical EngineeringISBN:9781118807330Author:James L. Meriam, L. G. Kraige, J. N. BoltonPublisher:WILEY