
(a)
Find the value of
(a)
Answer to Problem 16E
The value of
Explanation of Solution
Given data:
Refer to Figure 15.53 in the textbook.
Formula used:
Write the expression to calculate the impedance of the passive elements resistor, inductor and capacitor in s-domain.
Here,
Calculation:
Given that the output voltage should be taken across the inductor in series RLC circuit.
Generally, the transfer function of the series RLC circuit for which the output is taken across the inductor is,
The modified circuit of given circuit is drawn as Figure 1.
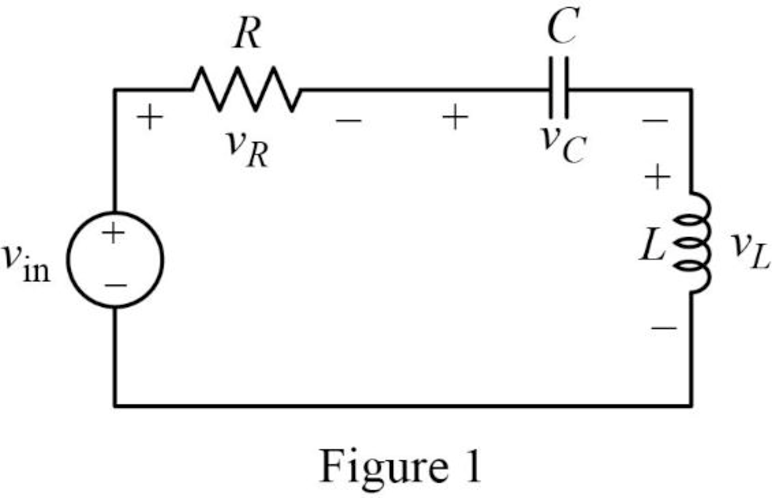
The Figure 1 is redrawn as impedance circuit in s-domain in Figure 2 using the equations (1), (2) and (3).
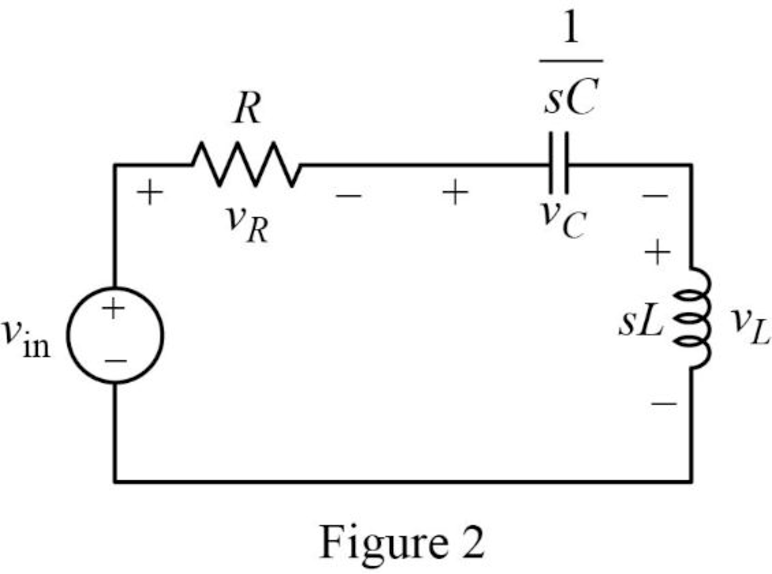
Write the general expression to calculate the transfer function of the circuit in Figure 2.
Here,
Apply Kirchhoff’s voltage law on Figure 2 to find
Rearrange the above equation to find
Substitute
Compare the above equation with the equation (4) to obtain the following values.
Rearrange the equation (6).
Rearrange the above equation to find
Rearrange the equation (7) to find
Substitute
Conclusion:
Thus, the value of
(b)
Find the values of inductor
(b)
Answer to Problem 16E
The value of inductor
Explanation of Solution
Given data:
The value of the resistor
The value of the resonant frequency
Calculation:
Case (i):
From part (a),
Substitute
Rearrange the above equation to find
Rearrange the above equation to find
Rearrange the equation (9).
Rearrange the above equation to find
Substitute
Rearrange the above equation to find
Take square root on both sides of the above equation to find
Substitute
Case (ii):
Substitute
Rearrange the above equation to find
Rearrange the above equation to find
Substitute
Rearrange the above equation to find
Take square root on both sides of the above equation to find
Substitute
Case (iii):
Substitute
Rearrange the above equation to find
Rearrange the above equation to find
Substitute
Rearrange the above equation to find
Take square root on both sides of the above equation to find
Substitute
Conclusion:
Thus, the value of inductor
(c)
Construct the magnitude Bode plots for the three cases
(c)
Explanation of Solution
Calculation:
Simplify the equation (4) to find
Case (i):
Substitute
Case (ii):
Substitute
Case (iii):
Substitute
The equations (15), (16) and (17) are the transfer function of the given series RLC circuit at three different cases
The MATLAB code is given below to sketch the magnitude Bode plots for the three cases using the equations (15), (16) and (17).
MATLAB Code:
clc;
clear all;
close all;
sys1=tf([1 0 0],[1 1000 (25*10^6)]);
sys2=tf([1 0 0],[1 5000 (25*10^6)]);
sys3=tf([1 0 0],[1 10000 (25*10^6)]);
bode(sys1,sys2,sys3)
legend({'sys1','sys2','sys3'},'Location','best')
Output:
The MATLAB output is shown in Figure 3.
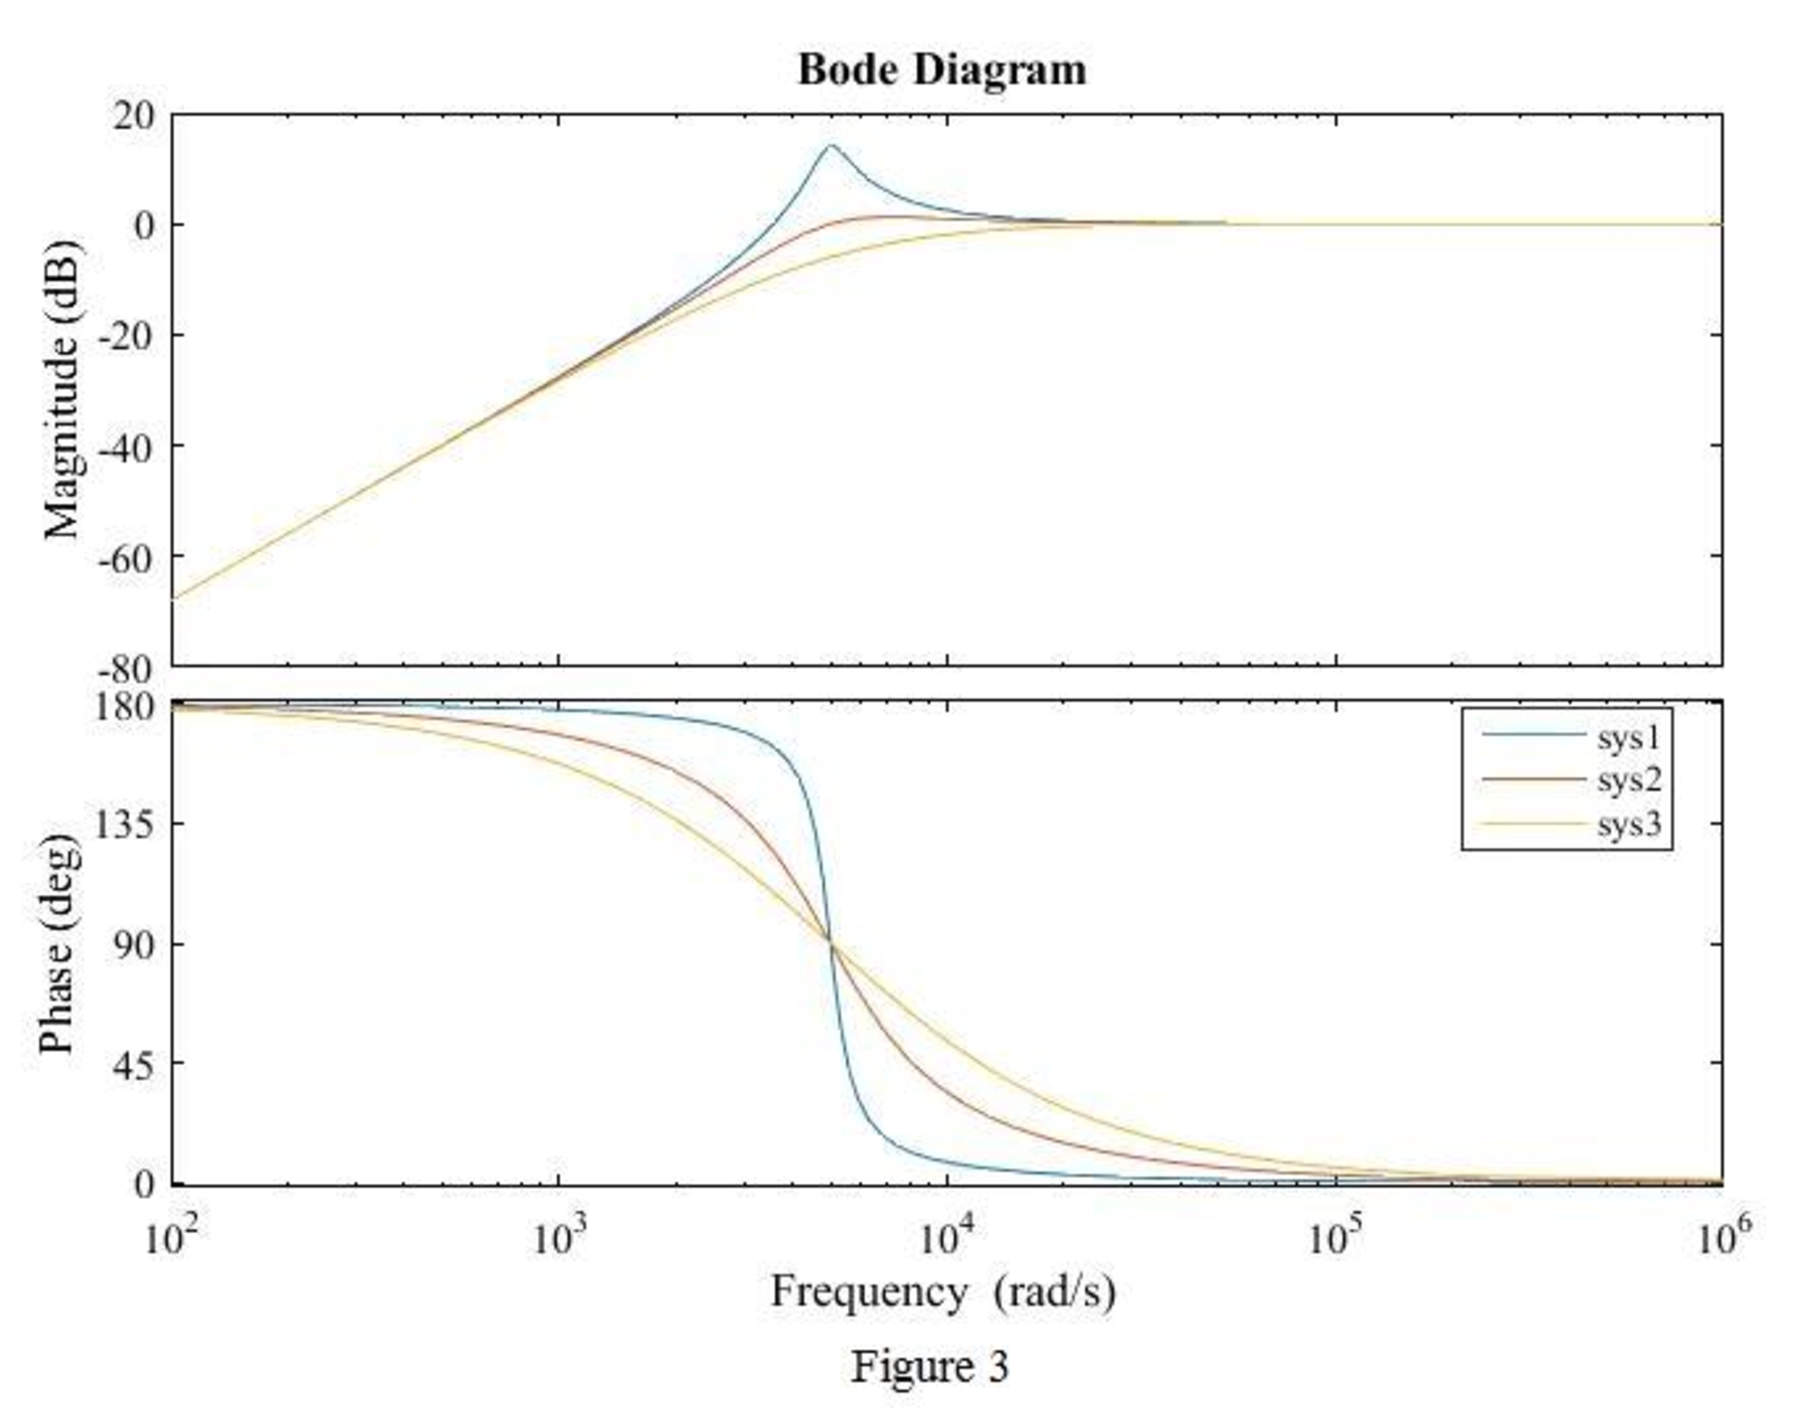
Conclusion:
Thus, the magnitude Bode plot for the three cases
Want to see more full solutions like this?
Chapter 15 Solutions
Loose Leaf for Engineering Circuit Analysis Format: Loose-leaf

- 3 9. The circuit is as shown in the figure, and the capacitance in the passband can be regarded as a short circuit. The gm of T1 is gm=1mS.Determine the voltage gain of the circuit Av=vo/vi= () VDD 20V R 10k Q C2 Re 300k Q 4.7 µF 0.02 µF Re 2M Q R Vo Re 100k 2 R 10k 2 47 uFarrow_forwardThe OLTF of a system is 30,000 G(s) = = s4+67s³+1017s²+8637s+13725 What is the phase crossover frequency? What is the gain crossover frequency? What is the gain margin? What is the phase margin? dB degrees. rad/s rad/sarrow_forwardA tank circuit contains a capacitor and an inductor that produce 30 Ω of reactance at the resonant frequency. The inductor has a Q of 15. The voltage of 277V is connected to the circuit. What is the total circuit current of the resonant frequency? Show your work. a) IT= 0.615 A b) IT= 0.423 A c) IT= 0.846 A d) IT= 0.321 Aarrow_forward
- 2. Derive the transfer function of this circuit in the form: Vo KN (s) Vi V₂ 8² + s +wo (1) where N (s) = s² or s or wo depending on whether the circuit is high pass, band pass or low pass and K = 1+ Obtain expressions for wo and Q from the derived transfer function RB RA in terms of the resistors and capacitors in the circuit. Eliminate RA, RB in the expression for Q by using K -1 = RA RBarrow_forwardK(s+1) The cross-over frequency of the system with transfer function and phase margin equal to 50° is,arrow_forwardDesign a circuit with Operational Amplifiers to produce the transfer function below. x + 2 5√ √ Vin 25 Vout 12-2Vin + = Vin dtarrow_forward
- Subject Test Note: You are attempting question 1 out of 12 K(s+1) The cross-over frequency of the system with transfer function and phase margin equal to 50* is, (a) 1.192 rad/see (b) 2.383 rad/see (e) 0.596 rad/sec (d) 4.766 rad see Answer A Subrnitarrow_forwardA differentiating circuit has series connection of R=5ohms and C=0.25F connected to an input voltage (Vi). Find the transfer function Vo(s)/Vi(s) if Vo is measured across the resistor?arrow_forward(a) find the transfer function (b) Determine the corner frequency (c) Find an expression for |H(w) and sketch the relationship between |H(w)| vs.w (d) Determine the voltage and power values at the output when the magnitude of the input voltage is 10 V and the frequency takes the following values 0.01wc, 0.1wc, 2wc, 2wc Q Search 48 * v,(t) 200 £2 ww 0.1 H (1) 11arrow_forward
- Please answer correctly, I'll give upvote. For the given RC circuit, determine the DC gain, the zero frequency ωz, and the pole frequency ωp, given that R=1kΩ, C1=10μF, and C2=1mF.arrow_forward11 The bode plot is a standard approach to feedback control systems analysis and design. The transfer function of a second-order system is given by G (s) = (s+a) (s+b)(s+c)(s+d) Here s = jw, where w is the frequency and a=0.74, b=2.48, c=8.81 and d=1.93 are real constants. Bode plot requires the calculation of amplitude and phase at certain frequencies and plotting them in two separate graphs. Calculate the amplitude of the Bode plot at the corner frequency w = b =2.48 rad/s. %3D Type your answer. 12 Considering the same function as in Question 11, obtain the phase at frequency 10 rad/s for a=9.383, b3D4.821, c=8.976 and d35.674 Type your answer.arrow_forwardObtain the phase and gain margins of the system shown in the figure below for the two cases where K = 10 and K = 100, and determine for which K the system is stable. (You can use Matlab to plot the Bode Diagram from where you can measure the gain and phase margins). R(s) K s(s+ 1) (s + 5) C(s)arrow_forward
 Introductory Circuit Analysis (13th Edition)Electrical EngineeringISBN:9780133923605Author:Robert L. BoylestadPublisher:PEARSON
 Delmar's Standard Textbook Of ElectricityElectrical EngineeringISBN:9781337900348Author:Stephen L. HermanPublisher:Cengage Learning
 Programmable Logic ControllersElectrical EngineeringISBN:9780073373843Author:Frank D. PetruzellaPublisher:McGraw-Hill Education
 Fundamentals of Electric CircuitsElectrical EngineeringISBN:9780078028229Author:Charles K Alexander, Matthew SadikuPublisher:McGraw-Hill Education
 Electric Circuits. (11th Edition)Electrical EngineeringISBN:9780134746968Author:James W. Nilsson, Susan RiedelPublisher:PEARSON
 Engineering ElectromagneticsElectrical EngineeringISBN:9780078028151Author:Hayt, William H. (william Hart), Jr, BUCK, John A.Publisher:Mcgraw-hill Education,