
Concept explainers
Videos
A “half-sinusoidal” waveform is shown in Fig. 17.31, which is the output of a half-wave rectifier used to help convert a sinusoidal input to dc. Find the Fourier series representation and plot the signal and Fourier series representation for n = 10 terms.
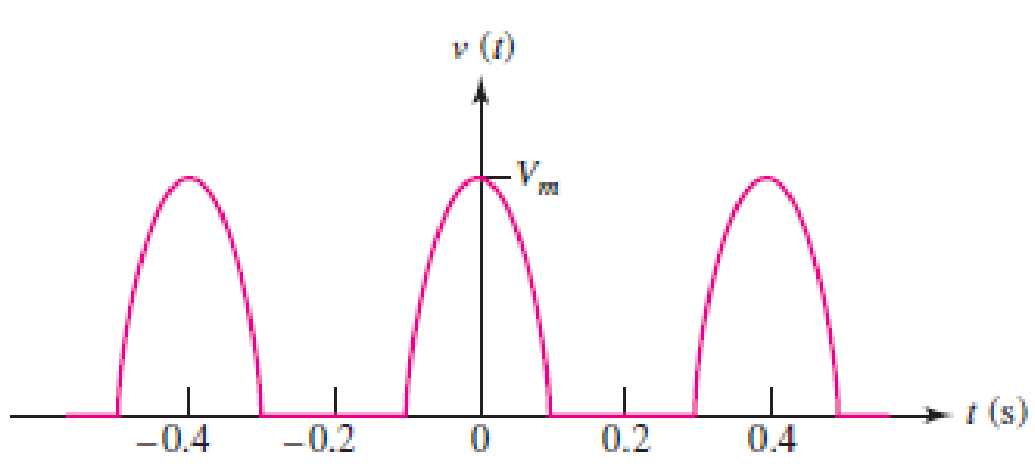
■ FIGURE 17.31
Find the Fourier series coefficients
Answer to Problem 11E
The values of the Fourier series coefficients
Explanation of Solution
Given data:
Refer to Figure 17.31 in the textbook.
Formula used:
Write the general expression for Fourier series expansion.
Write the general expression for Fourier series coefficient
Write the general expression for Fourier series coefficient
Write the general expression for Fourier series coefficient
Write the expression to calculate the fundamental angular frequency.
Here,
Calculation:
In the given Figure 17.31, the time period is
The function
Substitute 0.4 for T in equation (5) to find
Applying equation (6) in equation (2) to find
Simplify the above equation as follows,
For half wave symmetry and even symmetry,
For all values of ‘n’,
Applying equation (6) in equation (3) to find the value of coefficient
Consider the function,
Consider,
On differentiating the above expression,
Equation (8) will be follows,
In the above equation, consider,
By applying linearity,
In equation (10),
consider,
Let,
Equation (11) will be as follows,
Similarly, in equation (10),
consider,
Let,
Equation (12) will be as follows,
Substitute the values of m and l in equation (10) as follows,
Substitute the value of y in equation (9) as follows,
Therefore,
On applying the limits,
Simplify the equation as follows,
Simplify the equation as follows,
Substitute the value of
Substitute the value of
Representing through
By considering
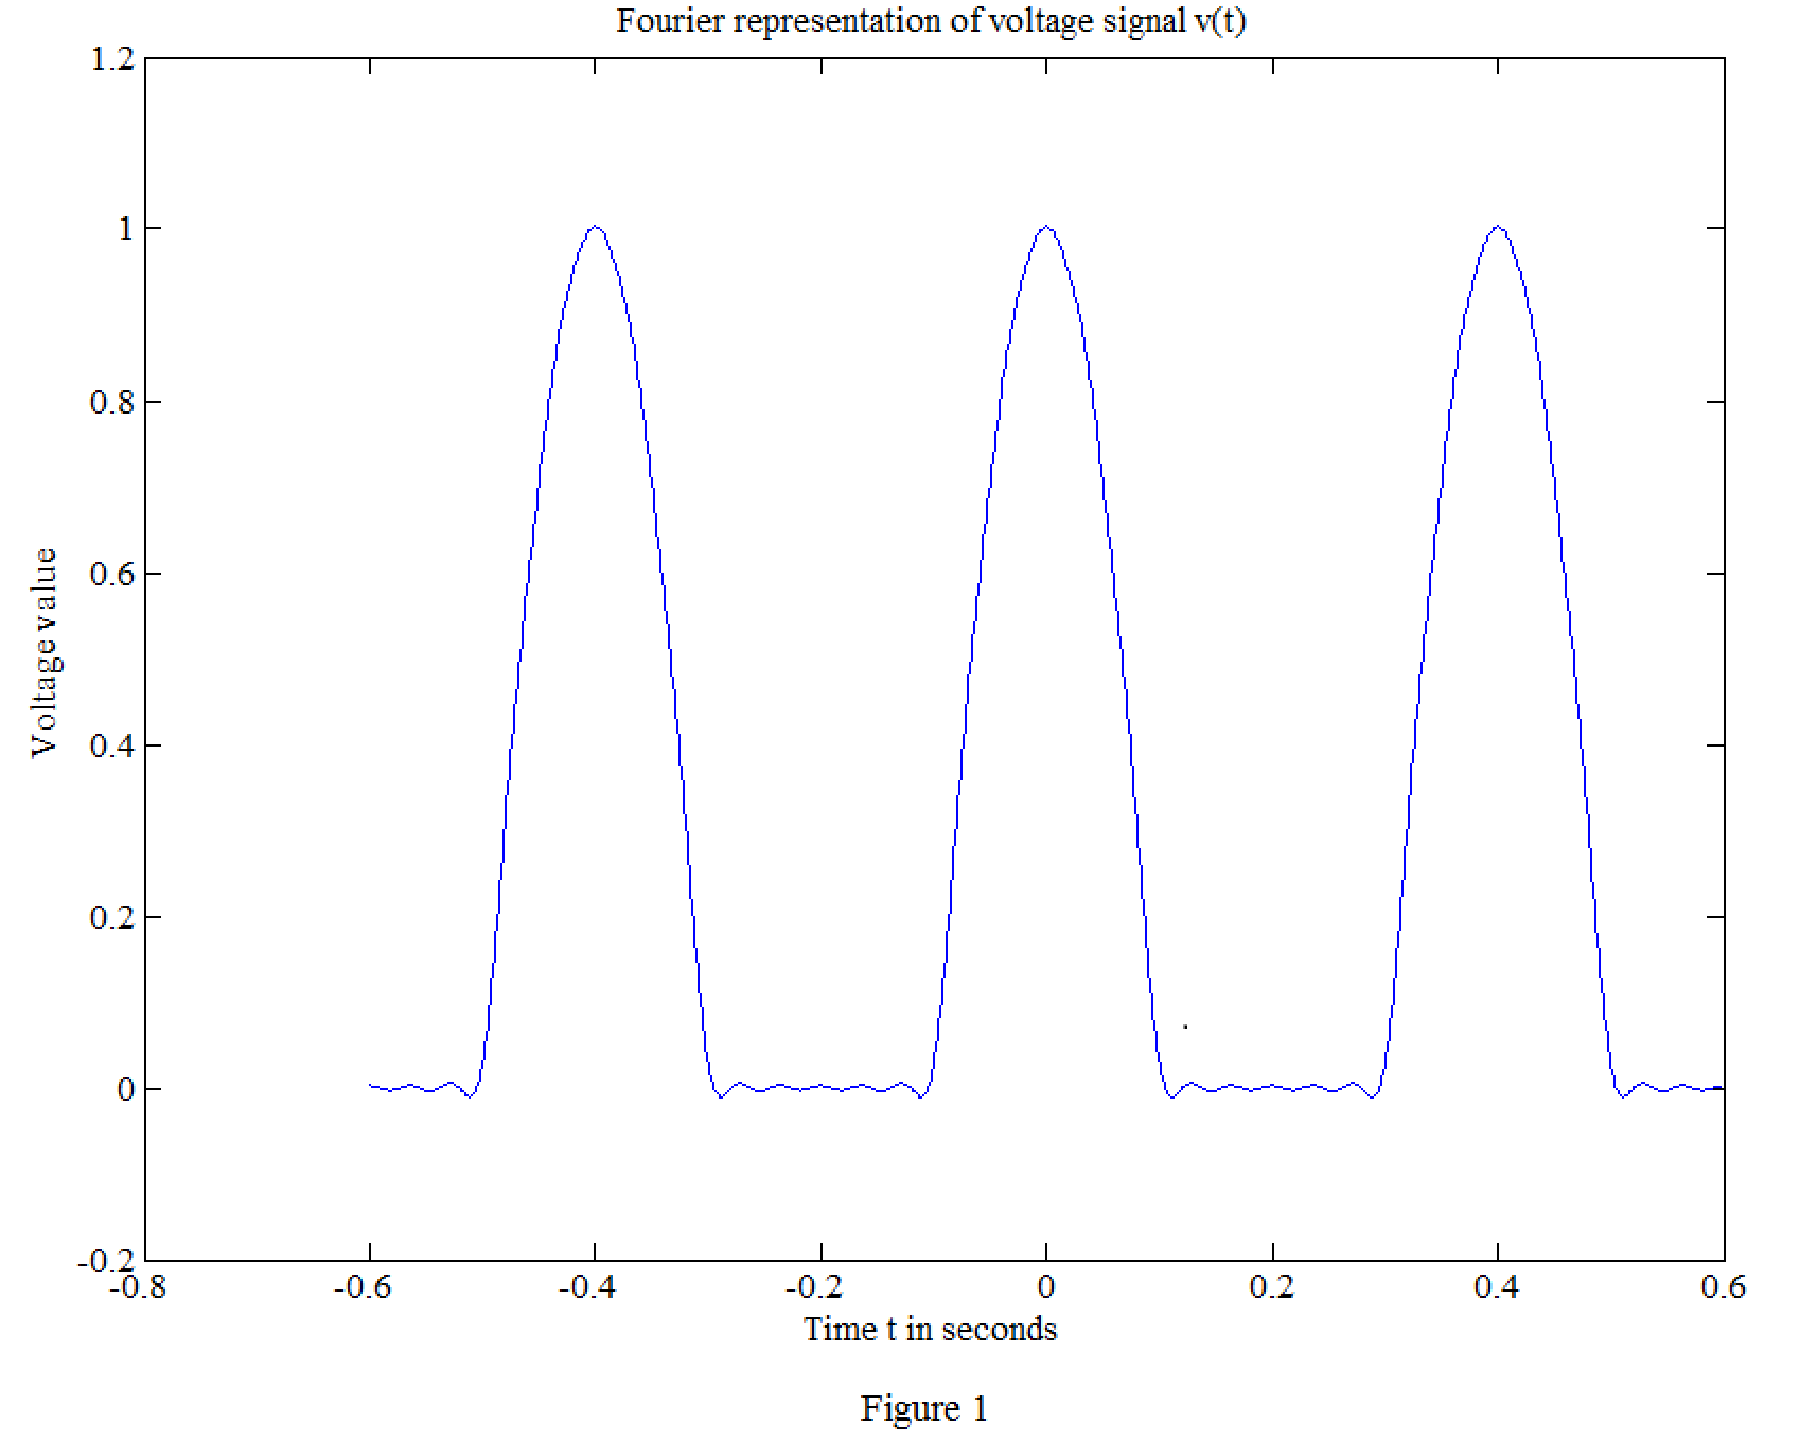
Matlab code for the signal
t=linspace(-0.6,0.6,1000); % vector for time over 1000 points.
Vm=1;
v0=Vm/(pi); % constant.
for i=1:1000;
sum=0;
sum=sum+ 0.5*cos(5*pi*t(i)) + (2/(3*pi))*cos(10*pi*t(i)) - (2/(15*pi))*cos(20*pi*t(i)) + (2/(35*pi))*cos(30*pi*t(i)) - (2/(63*pi))*cos(40*pi*t(i)) + (2/(99*pi))*cos(50*pi*t(i));
vt(i)=v0+sum;
end
plot(t,vt)
xlabel('Time t in seconds')
ylabel('Voltage value')
title('Fourier representation of voltage signal v(t)')
Matlab output:
The Fourier representation of voltage signal
Conclusion:
Thus, the values of the Fourier series coefficients
Want to see more full solutions like this?
Chapter 17 Solutions
Loose Leaf for Engineering Circuit Analysis Format: Loose-leaf
Additional Engineering Textbook Solutions
ELECTRICITY FOR TRADES (LOOSELEAF)
Principles Of Electric Circuits
ANALYSIS+DESIGN OF LINEAR CIRCUITS(LL)
Electronics Fundamentals: Circuits, Devices & Applications
Fundamentals of Electric Circuits
Microelectronics: Circuit Analysis and Design


- Put (TRUE) or (FALSE) and say why : - Fourier series is only applicable for periodic signals.arrow_forwardwhat is the definition and sketches and equations of the Analysis of Circuits (applications of the Fourier transforms)arrow_forwardC) Put (TRUE) or (FALSE) and say why : - Fourier series is only applicable for periodic signals.arrow_forward
- a) Explain with the aid of sketches the meaning of the following terms, as related to periodic waveforms. i) Even symmetry i) Odd symmetry ii) Half wave symmetry b) Determine the Fourier series of the following function: - f(t) = 3 f(t) = 5 0arrow_forwardThe periodic signal x(t) is shown in the following figure. It is a rectangular pulse repeated every 4 seconds. a) Write the mathematical representation of x(t) b) What is the Fourier Transform of x(t)? c) Sketch X(@), showing the important parameters. Make sure you show the magnitude of X(@) at w = 0.arrow_forward1. Express a function f (t) in Fourier series in complex form and then convert it to trigonometric form. Let be the periodic function (t), defined by: (the equation shown in the image). a) Draw the graph of (t) valid for -6arrow_forwardConsider the periodic signal r(t) shown below: x(t) (a) Derive the Fourier series coefficients a for the signal x(t). To receive full credit, you must show all work. (In other words, you can use a table to check your results, but you will not receive full credit unless you show how the coefficients are derived.) (b) The signal x(t) (shown on the previous page) is the input to an LTI system with the frequency response H(jw) shown below (magnitude and phase plots): |H(jw)| LH(jw) = - 10 -207 -107T +107 +207 Determine the output y(t) of this system when the input is æ(t). 2.arrow_forwardYou can do it with any method you want. Write the signal y(t) given in the figure in the form of a Fourier series. (It can be real or complex.) Y(+) A An tarrow_forwardElectrical Engineering please explain clearly in all the steps. the answer to part a is 0.5 and answer for part b is 5. a. Consider the periodic signal shown below: -1 0.5 1 1.5 2 2.5 t (seconds) What is a , i.e., the CT Fourier series coefficient when =0? b. Consider the periodic continuous-time signal shown below: 0.5 1 1.5 2.5 t (seconds) | How many of the Fourier series coefficients for this signal are non-zero?arrow_forwardFourier Analysis is a powerful analytical tool used in engineering. Describe why it is useful and give some physical examples where it may be implemented.What are the limitations of Fourier Analysis and explain the reasons whyarrow_forwardThe bandwidth of a composite signal is the difference between the highest and the lowest frequencies contained in that signal. (a) If a periodic signal is decomposed into five sine waves with frequencies of 100, 300, 500, 700, and 900 Hz, what is its bandwidth? Draw the spectrum, assuming all components have a maximum amplitude of 10 V. (b) A periodic signal has a bandwidth of 20 Hz. The highest frequency is 60 Hz. What is the lowest frequency? Draw the spectrum if the signal contains all frequencies of the same amplitude. A non-periodic composite signal has a bandwidth of 200 kHz, with a (c) middle frequency of 140 kHz and 20 V as peak amplitude. The two extreme frequencies have amplitude of 0. Draw the frequency domain of the signal. (d) The period of a signal is 100ms. What is its frequency in kilohertz?arrow_forward1) Write down the fourier transform of some standard signals : A) Unit step function. B) Triangular pulse.arrow_forwardarrow_back_iosSEE MORE QUESTIONSarrow_forward_ios
 Introductory Circuit Analysis (13th Edition)Electrical EngineeringISBN:9780133923605Author:Robert L. BoylestadPublisher:PEARSON
 Delmar's Standard Textbook Of ElectricityElectrical EngineeringISBN:9781337900348Author:Stephen L. HermanPublisher:Cengage Learning
 Programmable Logic ControllersElectrical EngineeringISBN:9780073373843Author:Frank D. PetruzellaPublisher:McGraw-Hill Education
 Fundamentals of Electric CircuitsElectrical EngineeringISBN:9780078028229Author:Charles K Alexander, Matthew SadikuPublisher:McGraw-Hill Education
 Electric Circuits. (11th Edition)Electrical EngineeringISBN:9780134746968Author:James W. Nilsson, Susan RiedelPublisher:PEARSON
 Engineering ElectromagneticsElectrical EngineeringISBN:9780078028151Author:Hayt, William H. (william Hart), Jr, BUCK, John A.Publisher:Mcgraw-hill Education,