
Concept explainers
Interpretation:
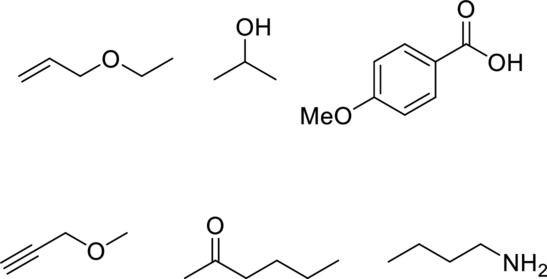
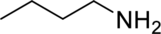
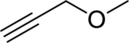
The given below compound has to be matched with the appropriate spectrum.
Concept Introduction:
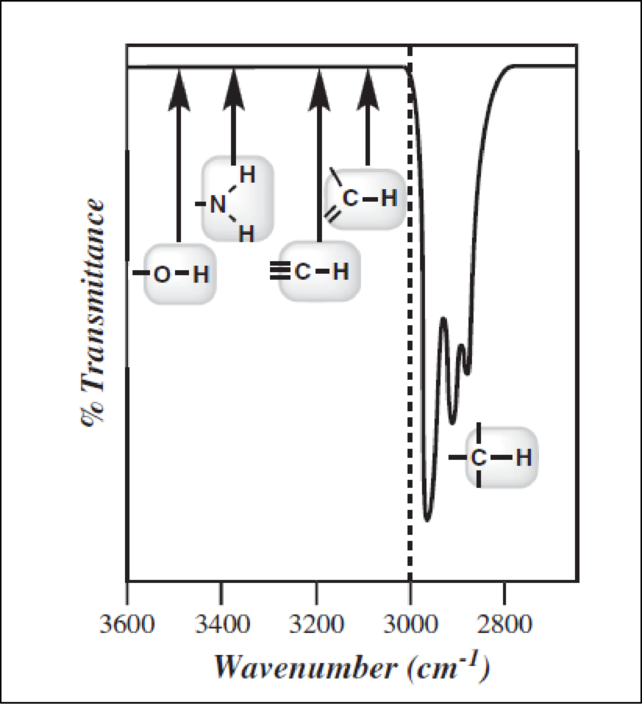
To analyze an IR spectrum certain tools are needed. The first step is to draw a line at
Double bonds:
Triple bonds:
While looking for
Explanation of Solution
Consider spectrum A.
There are no signals in the triple-bond region, but there is one signal in the double-bond region. The signal at
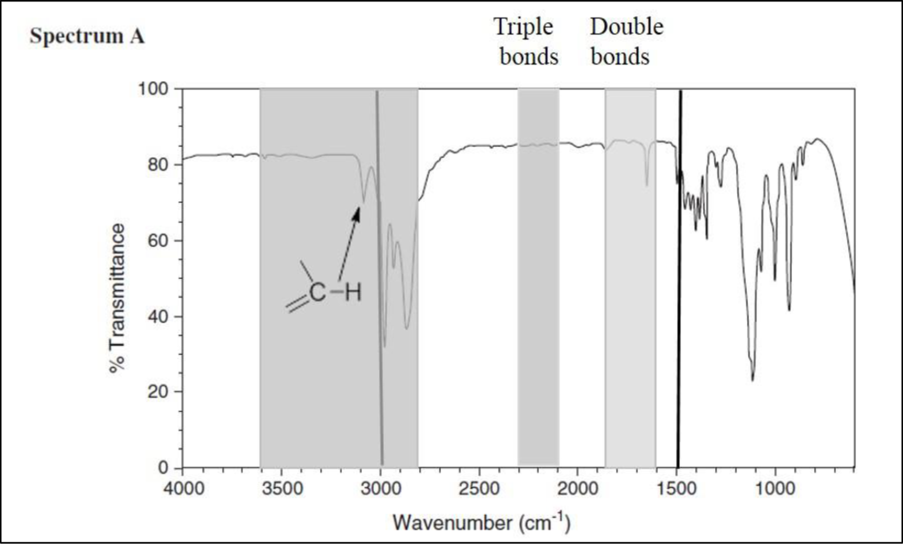
This spectrum exhibits one signal just above

Consider spectrum B.
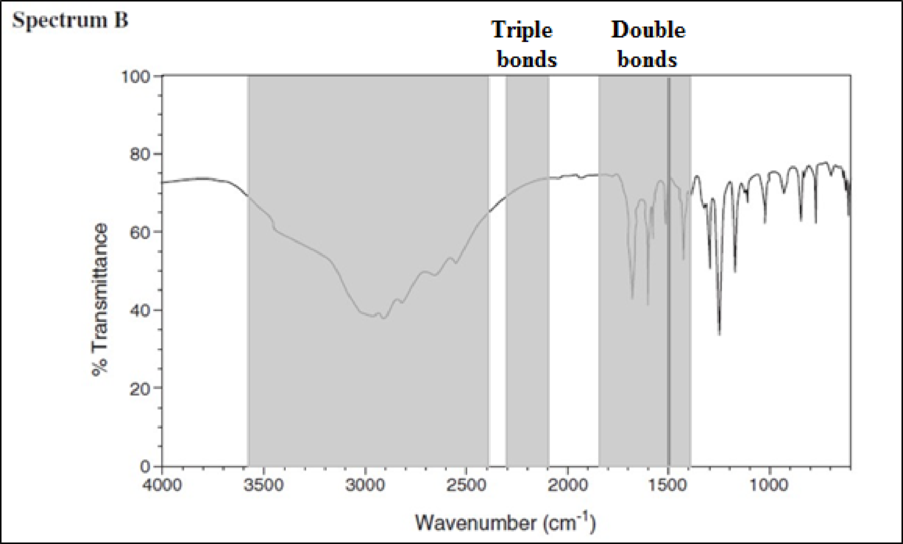
There are no signals in the triple-bond region, but there are signals in the double-bond region. The signals between
Consider spectrum C.
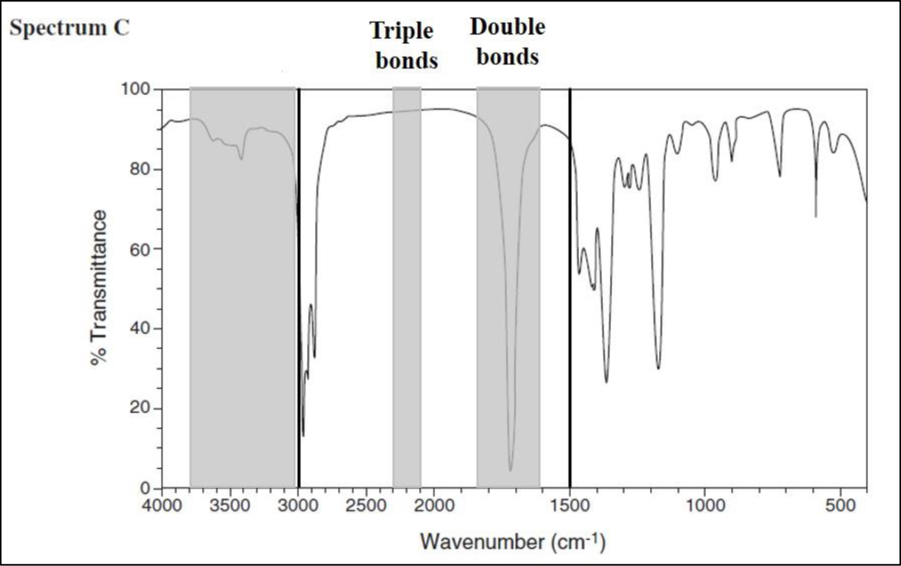
There are no signals in the triple-bond region, but there are signals in the double-bond region. The signal at
The little bump between
Consider spectrum D.
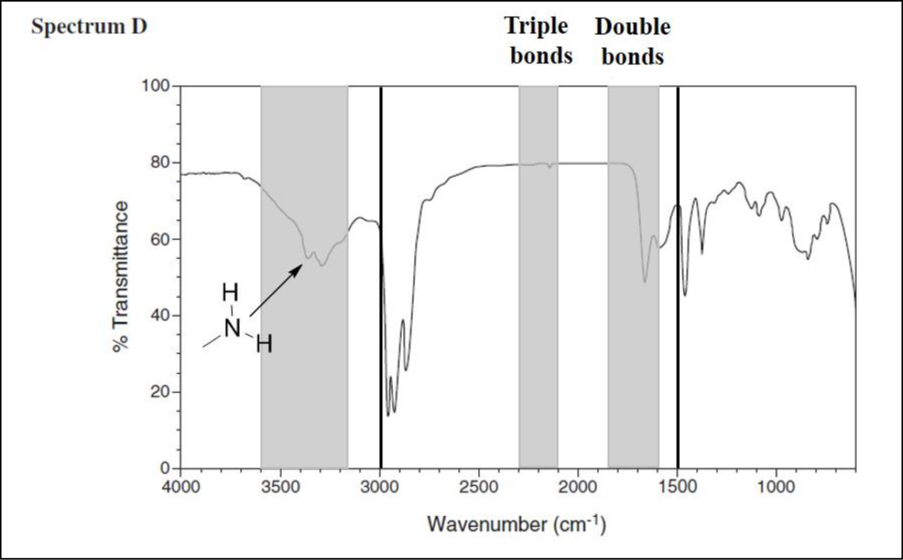
There are no signals in the triple-bond region, but there are signals in the double-bond region. The signal at
Consider spectrum E.
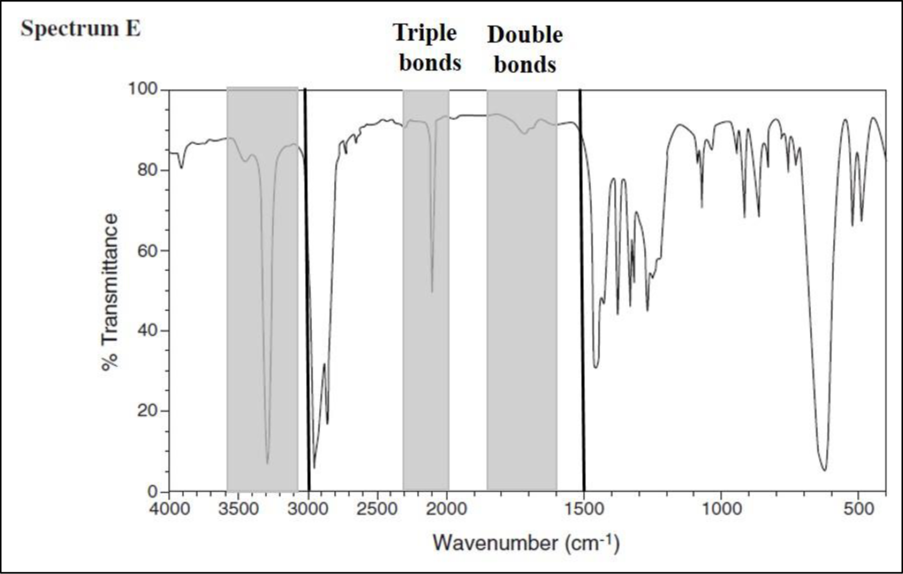
There is a signal in the triple-bond region, but there are no signals in the double-bond region. The signal at
Consider spectrum F.
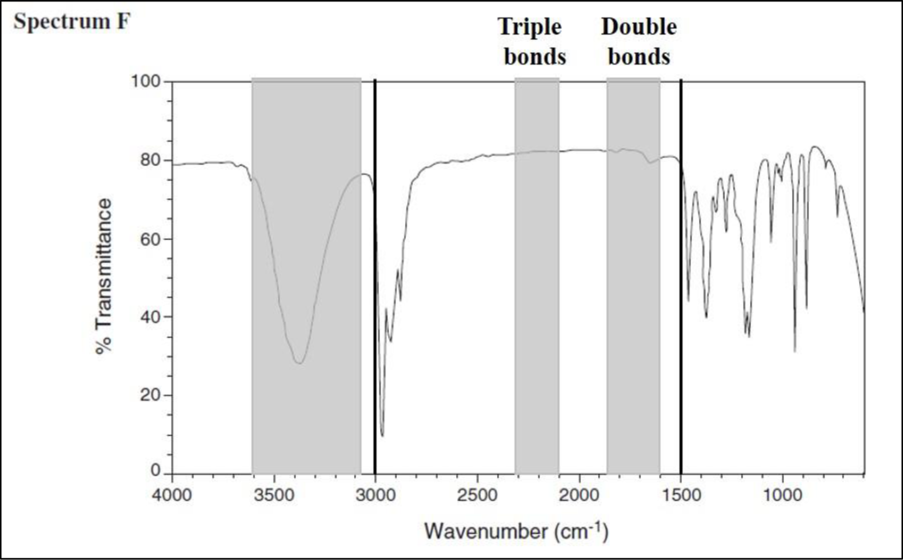
There are no signals in the triple-bond region and also in the double-bond region. Draw a line at

Want to see more full solutions like this?
Chapter 2 Solutions
Organic Chemistry As a Second Language: Second Semester Topics


- Can you help me determine the structure of the compound represented in this spectrum?arrow_forwardWhich peak in a MS is used to determine the molecular formula? a b с d e f The base peak, which is the set of peaks farthest to the left. The base peak, which is the set of peaks farthest to the right. The parent ion, which is the set of peaks farthest to the left. The parent ion, which is the set of peaks farthest to the right. The parent ion, which is the tallest set of peaks on the spectrum. The base peak, which is the tallest set of peaks on the spectrum.arrow_forwardPredict the ratio of areas of the signals in each spectrumarrow_forward
- Each line in a 13CNMR spectrum corresponds to a different kind of carbon atom. How many 13CNMR signals does each compound exhibit? ( please explain)arrow_forwardDraw the structure of the correct compound on each spectrum and match each type of hydrogen on the structure to the corresponding peak on the spectrum. Thanksarrow_forwardThe 1H-NMR spectrum of 1-chloropropane shows three signals and the 1H-NMR spectrum of 2-chloropropane shows two signals. Draw these two molecules and determine the relative integrals of each signal.arrow_forward
- Choose the molecule to which each of these two IR spectrums correspond (one possible answer per IR spectrum).arrow_forwardMatch the peaks in this spectrum with hydrogens on the structure below. A) H3C I H₂ 3.0 H₂ CH3 IV 2.0 ppm 1.0 1.68 ppm II: 0.99 ppm III: 2.32 ppm IV: 3.61 ppm 1: B) I: 0.99 ppm II: 1.68 ppm III: 2.32 ppm IV: 3.61 ppm C) I: II: 1.68 ppm 0.99 ppm +arrow_forwardThe structure of citronellal is shown below, with the carbon atoms numbered. Also shown is a table of 13C NMR signals for the molecule and the 13C-NMR DEPT spectrum. Assign each signal in the 13C-NMR spectrum to a numbered carbon in the molecule.arrow_forward
 Organic Chemistry: A Guided InquiryChemistryISBN:9780618974122Author:Andrei StraumanisPublisher:Cengage Learning