
Essentials of Corporate Finance (Mcgraw-hill/Irwin Series in Finance, Insurance, and Real Estate)
9th Edition
ISBN: 9781259277214
Author: Stephen A. Ross Franco Modigliani Professor of Financial Economics Professor, Randolph W Westerfield Robert R. Dockson Deans Chair in Bus. Admin., Bradford D Jordan Professor
Publisher: McGraw-Hill Education
expand_more
expand_more
format_list_bulleted
Videos
Textbook Question
Chapter 3, Problem 46QP
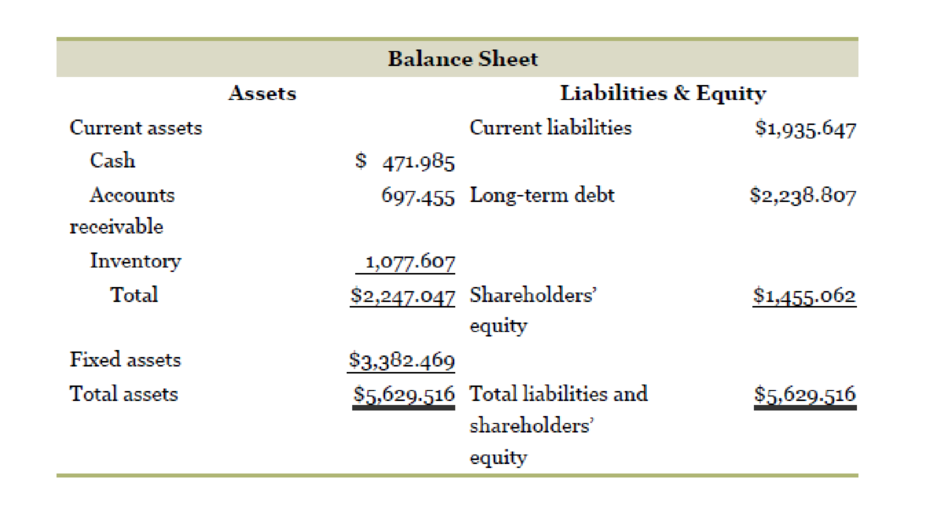
Expanded DuPont Identity. Hershey Co. reported the following income statement and balance sheet (in millions) for 2014. Construct the expanded DuPont identity similar to Figure 3.1. What is the company’s
| Income Statement | |
| Sales | $7,421,768 |
| CoGS | 4,085.602 |
| Other costs | 1,770.279 |
| 176.312 | |
| EBIT | $1,389.575 |
| Interest | 83.532 |
| EBT | $1,306.043 |
| Taxes | 459.131 |
| Net income | $846.912 |
Expert Solution & Answer
Want to see the full answer?
Check out a sample textbook solution
Students have asked these similar questions
Below are the ratio results for Abcom for the year 2022.
Performance
Operating margin -18.66%
Asset turnover 0.16
Return on Capital Employed -7.64%
Working capital
Inventory days 88.88 days
Debtor days 46.18 days
Trade creditor days 68.11 days
Liquidity
Current ratio 0.30
Acid test 0.25
Solvency
Interest cover -2.56
Shareholder's view
Return on equity 7.16%
Required;
Analyse and interpret the meaning of these results.
Given the income statement below, Mega Trade Inc. wants to find the resulting net income for the year 2018 (in million). What is the right amount?
Income Statement ($ Million)
Year End
2015
2016
2017
2018
Sales
1,234.90
1,251.70
1,300.40
1,334.40
Cost of Sales
-679.1
-659
-681.3
-667
Selling & Administration
-339.7
-348.6
-351.2
-373.3
Depreciation
-47.5
-52
-55.9
-75.2
Other Income/Expenses
11.8
7.6
7
8.2
Interest Income
1.3
1.4
1.7
2
Interest Expense
-16.2
-15.1
-20.5
-23.7
Income Taxes
-56.8
-64.2
-67.5
-72.6
Dividends
-38.3
-38.7
-39.8
-40.1
CHOICES:
A. 108.7B. 132.7C. No choice givenD. 132.8E. 121.8
Given the income statement below, Mega Trade Inc. wants to find the resulting net income for the year 2016 (in million). What is the right amount?
Income Statement ($ Million)
YEAR END
YEAR END
YEAR END
YEAR END
2015
2016
2017
2018
Sales
1,234.90
1,251.70
1,300.40
1,334.40
Cost Sales
-679.1
-659
-681.3
-667
Gross Operating Income
Selling & Administration
-339.7
-348.6
-351.2
-373.3
Depreciation
-47.5
-52
-55.9
-75.2
Other Income/Expenses
11.8
7.6
7
8.2
Earnings Before Interest and Taxes
Interest Income
1.3
1.4
1.7
2
Interest Expense
-16.2
-15.1
-20.5
-23.7
Pre Tax Income
Income Taxes
-56.8
-64.2
-67.5
-72.6
Net Income
Dividends
-38.3
-38.7
-39.8
-40.1
Chapter 3 Solutions
Essentials of Corporate Finance (Mcgraw-hill/Irwin Series in Finance, Insurance, and Real Estate)
Ch. 3.1 - Why is it often necessary to standardize financial...Ch. 3.1 - Prob. 3.1BCQCh. 3.2 - What are the five groups of ratios? Give two or...Ch. 3.2 - Turnover ratios all have one of two figures as...Ch. 3.2 - Profitability ratios all have the same figure in...Ch. 3.2 - Given the total debt ratio, what other two ratios...Ch. 3.3 - Return on assets, or ROA, can be expressed as the...Ch. 3.3 - Return on equity, or ROE, can be expressed as the...Ch. 3.4 - What does a firms internal growth rate tell us?Ch. 3.4 - What does a firms sustainable growth rate tell us?
Ch. 3.4 - Why is the sustainable growth rate likely to be...Ch. 3.5 - Prob. 3.5ACQCh. 3.5 - Prob. 3.5BCQCh. 3.5 - Prob. 3.5CCQCh. 3.5 - Prob. 3.5DCQCh. 3 - Section 3.1A common-size balance sheet expresses...Ch. 3 - What are the categories of traditional financial...Ch. 3 - Prob. 3.3CCh. 3 - Prob. 3.4CCh. 3 - Prob. 3.5CCh. 3 - Current Ratio. What effect would the following...Ch. 3 - Current Ratio and Quick Ratio. In recent years,...Ch. 3 - Prob. 3CTCRCh. 3 - Financial Ratios. Fully explain the kind of...Ch. 3 - Standardized Financial Statements. What types of...Ch. 3 - Prob. 6CTCRCh. 3 - Prob. 7CTCRCh. 3 - Prob. 8CTCRCh. 3 - Industry-Specific Ratios. So-called same-store...Ch. 3 - Industry-Specific Ratios. There are many ways of...Ch. 3 - Prob. 11CTCRCh. 3 - Financial Statement Analysis. In the previous...Ch. 3 - Prob. 1QPCh. 3 - Calculating Profitability Ratios. Aguilera, Inc.,...Ch. 3 - Calculating the Average Collection Period. Ordonez...Ch. 3 - Calculating Inventory Turnover. Bobaflex...Ch. 3 - Calculating Leverage Ratios. Fincher, Inc., has a...Ch. 3 - Calculating Market Value Ratios. Rossdale, Inc.,...Ch. 3 - Prob. 7QPCh. 3 - DuPont Identity. Jiminy Cricket Removal has a...Ch. 3 - Calculating Average Payables Period. For the past...Ch. 3 - Equity Multiplier and Return on Equity. Shelton...Ch. 3 - Internal Growth. If Williams, Inc., has an ROA of...Ch. 3 - Sustainable Growth. If the Crash Davis Driving...Ch. 3 - Sustainable Growth. Based on the following...Ch. 3 - Prob. 14QPCh. 3 - Prob. 15QPCh. 3 - Calculating Financial Ratios. Based on the balance...Ch. 3 - DuPont Identity. Suppose that the Bethesda Mining...Ch. 3 - Prob. 18QPCh. 3 - Return on Assets. Beckinsale, Inc., has a profit...Ch. 3 - Calculating Internal Growth. The most recent...Ch. 3 - Calculating Sustainable Growth. For Shinoda...Ch. 3 - Total Asset Turnover. Kalebs Karate Supply had a...Ch. 3 - Return on Equity. Carroll, Inc., has a total debt...Ch. 3 - Market Value Ratios. Ames, Inc., has a current...Ch. 3 - Prob. 25QPCh. 3 - Enterprise ValueEBITDA Multiple. The market value...Ch. 3 - Prob. 27QPCh. 3 - Ratios and Fixed Assets. The Smathers Company has...Ch. 3 - Prob. 29QPCh. 3 - Prob. 30QPCh. 3 - Prob. 31QPCh. 3 - Calculating the Times Interest Earned Ratio. For...Ch. 3 - Return on Assets. A fire has destroyed a large...Ch. 3 - Prob. 34QPCh. 3 - SMOLIRA GOLF. INC. 2016 Income Statement Sales...Ch. 3 - Prob. 36QPCh. 3 - Market Value Ratios. Smolira Golf has 10,000...Ch. 3 - Interpreting Financial Ratios. After calculating...Ch. 3 - Growth and Profit Margin. Fulkerson Manufacturing...Ch. 3 - Market Value Ratios. Abercrombie Fitch and...Ch. 3 - Growth and Assets. A firm wishes to maintain an...Ch. 3 - Prob. 42QPCh. 3 - Prob. 43QPCh. 3 - Constraints on Growth. High Flyer, Inc., wishes to...Ch. 3 - Internal and Sustainable Growth Rates. Best Buy...Ch. 3 - Expanded DuPont Identity. Hershey Co. reported the...Ch. 3 - Ratios and Financial Planning at SS Air, Inc....Ch. 3 - Prob. 2CCCh. 3 - Prob. 3CCCh. 3 - Ratios and Financial Planning at SS Air, Inc....
Knowledge Booster


Learn more about
Need a deep-dive on the concept behind this application? Look no further. Learn more about this topic, finance and related others by exploring similar questions and additional content below.Similar questions
- Given the income statement below, Mega Trade Inc. wants to find the resulting net income for the year 2018 (in million). What is the right amount? Income Statement ($ Million) YEAR END YEAR END YEAR END YEAR END 2015 2016 2017 2018 Sales 1,234.90 1,251.70 1,300.40 1,334.40 Cost Sales -679.1 -659 -681.3 -667 Gross Operating Income Selling & Administration -339.7 -348.6 -351.2 -373.3 Depreciation -47.5 -52 -55.9 -75.2 Other Income/Expenses 11.8 7.6 7 8.2 Earnings Before Interest and Taxes Interest Income 1.3 1.4 1.7 2 Interest Expense -16.2 -15.1 -20.5 -23.7 Pre Tax Income Income Taxes -56.8 -64.2 -67.5 -72.6 Net Income Dividends -38.3 -38.7 -39.8 -40.1 Addition to Retained Earningsarrow_forwardDuPont system of analysis Use the following financial information for AT&T and Verizon to conduct a DuPont system of analysis for each company. AT&T Sales $164,000 Earnings available for common stockholders 13,333 Total assets 403,721 Stockholders' equity 124,210 a. Which company has the higher net profit margin? Higher asset turnover? b. Which company has the higher ROA? The higher ROE? c. Which company has the higher financial leverage multiplier? a. Net profit margin (Round to three decimal places.) AT&T Net profit margin Verizon C Verizon $131,868 13.708 244,180 24,032arrow_forwardThe 2017 annual report of Tootsie Roll Industries contains the following information. (in millions) December 31, 2017 0000 December 31, 2016 Total assets $930.9 $920.1 Total liabilities 197.1 208.6 Net sales 515.7 517.4 Net income 80.7 67.2 Instructions Compute the following ratios for Tootsie Roll for 2017. a. Asset turnover. b. Return on assets. c. Profit margin on sales. d. How can the asset turnover be used to compute the return on assets?arrow_forward
- Given the historical income statement of Mega Trade Inc., how much would be added to the company's retained earning for the year 2016 (in millions)? Income Statement ($ Million) Income Statement ( $ Million) Year End 2015 2016 2017 2019 Sales 1, 234,90 1,251.40 1,300.40 1,334.40 Cost of Sales -679.1 -659 -681.3 -667 Gross Operating Income Selling & Administration -339.7 -348.6 -351.2 -373.3 Depreciation -47.5 -52 -55.9 -75.2 Other Income / Expenses 11.8 7.6 7 8.2 Earnings Before Interest and Taxes Interest Income 1.3 1.4 1.7 2 Interest Expense -16.2 -15.1 -20.5 -23.7 Pre Tax Income Income Taxes -56.8 -64.2 -67.5 -72.6 Net Income Dividends -38.3 -38.7 -39.8 -40.1arrow_forwardIn the income statement below, ABC Trade Inc. wants to find the resulting net income for the year 2018 (in million). What is the right amount? Income Statement ($ Million) Year End 2015 2016 2017 2018 Sales 1,234.90 1,251.70 1,300.40 1,334.40 Cost of Sales (679.10) (659.00) (681.30) (667.00) Gross Operating Income Selling & Administration (339.70) (348.60) (351.20) (373.30) Depreciation (47.50) (52.00) (55.90) (75.20) Other Income/Expenses 11.80 7.60 7.00 8.20 Earnings Before Interest and Taxes Interest Income 1.30 1.40 1.70 2.00 Interest Expense (16.20) (15.10) (20.50) (23.70) Pre Tax Income Income Taxes (56.80) (64.20) (67.50) (72.60) Net Income Dividends (38.30) (38.70) (39.80) (40.10) Addition to Retained Earnings Group of answer choices 121.8 108.7 132.7 132.8 No choice givenarrow_forwardUse the following tables to answer the question: LOGIC COMPANY Income Statement For years ended December 31, 2016 and 2017 (values in $) 2016 2017 Gross sales 19,800 15,600 Sales returns and allowances 900 100 Net sales 18,900 15,500 COGS 11,800 8,800 Gross profit 7,100 6,700 Depreciation 780 640 Selling and administrative expenses 2,800 2,400 Research 630 540 Miscellaneous 440 340 Total operating expenses 4,650 3,920 Income before interest and taxes 2,450 2,780 Interest expense 640 540 Income before taxes 1,810 2,240 Provision for taxes 724 896 LOGIC COMPANY Balance Sheet For years ended December 31, 2016 and 2017 (values in $) 2016 2017 Current assets 12,300 9,400 Accounts receivable 16,900 12,900 Merchandise inventory 8,900 14,400 Prepaid expenses 24,400 10,400 Total current assets 62,500 47,100 Building (net) 14,900 11,400 Land 13,900 9,400 Total plant and equipment 28,800 20,800 Total assets 91,300 67,900 Accounts payable 13,400 7,400 Salaries payable 7,500 5,400 Total current…arrow_forward
- Please find below Financial Statement extracts of Nestle from year 2017 and 2018. Based on this information please answer following question from a perspective of Financial Analyst (justify your answers with data as well the reason for choosing your ratios for your analysis) .The company’s total assets at year-end 2016 were CHF 131,900 million. What reasonable conclusions an analyst might make about the companies efficiency, Companies solvency, Liquidity and Profitability? In millions of CHF Notes 2018 2017 * Sales 3 91,439 89,590 Cost of goods sold (46,070) (45,571) Trading operating profit 3 13,789 13,277 Operating profit 13,752 10,156 Profit before taxes, associates and joint ventures 12,991 9,460 Taxes 13 (3,439) (2,773) Profit for the year 10,468 7,511 Notes 2018 2017 * Assets Current assets Cash and cash equivalents 12/16…arrow_forwardGiven the historical income statement of Mega Trade Inc., how much would be added to the company's retained earning for the year 2016 (in millions)? Income Statement ( $ Million) Year End 2015 2016 2017 2019 Sales 1, 234.90 1,251.70 1,300.40 1,334.40 Cost of Sales -679.1 -659 -681.3 -667 Gross Operating Income Selling & Administration -339.7 -348.6 -351.2 -373.3 Depreciation -47.5 -52 -55.9 -75.2 Other Income / Expenses 11.8 7.6 7 8.2 Earnings Before Interest and Taxes Interest Income 1.3 1.4 1.7 2 Interest Expense -16.2 -15.1 -20.5 -23.7 Pre Tax Income Income Taxes -56.8 -64.2 -67.5 -72.6 Net Income Dividends -38.3 -38.7 -39.8 -40.1arrow_forwardIncome statement. Construct the Barron Pizza, Inc. income statement for the year ending 2015 with the following information (the dollar amounts are in thousands of dollars). Shares outstanding: 16,673,000 Tax rate: 37.5% Interest expense. $6,072 Revenue: $889,345 Depreciation: $31,256 Selling, general, and administrative expense: S77.498 Other income. $1,118 Research and development: $4,193 Cost of goods sold: $750,757 Note Enter all expenses as negative numbers. EBIT Income before tax Net income Shares outstanding Earnings per share %24 %24 %24 %24 %24 %24arrow_forward
- The following condensed information is reported by Beany Baby Collectibles. Income Statement Information Sales revenue Cost of goods sold Net income Balance Sheet Information Current assets Long-term assets Total assets Current liabilities Long-term liabilities Common stock Retained earnings Total liabilities and stockholders' equity Required: 1. Calculate the following profitability ratios for 2024: 2. Determine the amount of dividends paid to shareholders in 2024. 2024 $10,440,000 6,827,760 360,000 $1,200,000 1,500,000 2023 $1,600,000 $1,500,000 2,200,000 1,900,000 $3,800,000 $3,400,000 800,000 300,000 $3,800,000 $8,400,000 5,900,000 248,000 $900,000 1,500,000 800,000 200,000 $3,400,000arrow_forwardThe following balances were reported in the financial statements for Ruby Company. 2016 2015 Net Sales $1,650,000 $1,750,000 Net Income 170,000 205,000 Current Assets 410,000 535,000 Current Liabilities 170,000 210,000 Total Liabilities 500,000 675,000 Total Assets 1,550,000 2,450,000 Required: 1. Compute the following ratios for 2016 and 2015 for Ruby Company. a. Return on sales ratio b. Current ratio c. Debt-to-total-assets ratioarrow_forwardFor fiscal year 2018, Walmart Inc. (WMT) had total revenues of $500.34 billion, net income of $9.86 billion, total assets of $204.52 billion, and total shareholders' equity of $77.87 billion. a. Calculate Walmart's ROE directly, and using the DuPont Identity. b. Comparing with the data for Costco, use the DuPont Identity to understand the difference between the two firms' ROES. Data table For fiscal year 2018, Costco Wholesale Corporation (COST) had a net profit margin of 2.08%, asset turnover of 3.55, and a book equity multiplier of 3.37. Costco's ROE (DuPont) is 24.88%.arrow_forward
arrow_back_ios
SEE MORE QUESTIONS
arrow_forward_ios
Recommended textbooks for you
 Essentials Of InvestmentsFinanceISBN:9781260013924Author:Bodie, Zvi, Kane, Alex, MARCUS, Alan J.Publisher:Mcgraw-hill Education,

 Foundations Of FinanceFinanceISBN:9780134897264Author:KEOWN, Arthur J., Martin, John D., PETTY, J. WilliamPublisher:Pearson,
 Fundamentals of Financial Management (MindTap Cou...FinanceISBN:9781337395250Author:Eugene F. Brigham, Joel F. HoustonPublisher:Cengage Learning
 Corporate Finance (The Mcgraw-hill/Irwin Series i...FinanceISBN:9780077861759Author:Stephen A. Ross Franco Modigliani Professor of Financial Economics Professor, Randolph W Westerfield Robert R. Dockson Deans Chair in Bus. Admin., Jeffrey Jaffe, Bradford D Jordan ProfessorPublisher:McGraw-Hill Education
Essentials Of Investments
Finance
ISBN:9781260013924
Author:Bodie, Zvi, Kane, Alex, MARCUS, Alan J.
Publisher:Mcgraw-hill Education,
Foundations Of Finance
Finance
ISBN:9780134897264
Author:KEOWN, Arthur J., Martin, John D., PETTY, J. William
Publisher:Pearson,
Fundamentals of Financial Management (MindTap Cou...
Finance
ISBN:9781337395250
Author:Eugene F. Brigham, Joel F. Houston
Publisher:Cengage Learning
Corporate Finance (The Mcgraw-hill/Irwin Series i...
Finance
ISBN:9780077861759
Author:Stephen A. Ross Franco Modigliani Professor of Financial Economics Professor, Randolph W Westerfield Robert R. Dockson Deans Chair in Bus. Admin., Jeffrey Jaffe, Bradford D Jordan Professor
Publisher:McGraw-Hill Education
Financial ratio analysis; Author: The Finance Storyteller;https://www.youtube.com/watch?v=MTq7HuvoGck;License: Standard Youtube License