
Videos
Expand Your knowledge: Logarithmic Transformations. Exponential Growth Model There are several extensions of linear regression that apply to exponential growth and power law models. Problems 22-25 will outline some of these extensions. First of all. recall that a variable grows linearly over time if it adds a fixed increment during each equal period. Exponential growth occurs when a variable is multiplied by a fixed number during each period. This means that exponential growth increases by a fixed multiple or percentage of the previous amount. College algebra can be used to show that if a variable grows exponentially, then its logarithm grows linearly. The exponential growth model is
How do we know when we are dealing with exponential growth, and how can we estimate
| x | 1 | 2 | 3 | 4 | 5 |
| y | 3 | 12 | 22 | 51 | 145 |
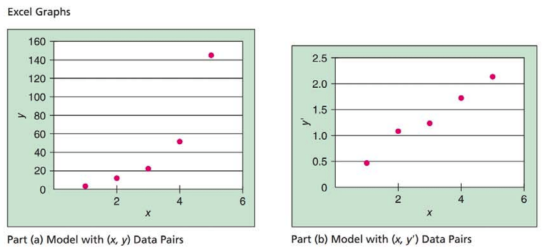
Consider the following data, where x = time in hours and y = number of bacteria in a laboratory culture at the end of x hours.
(a) Look at the Excel graph of the
(b) Now consider a transformation
| x | 1 | 2 | 3 | 4 | 5 |
| y'=- log y | 0.477 | 1.079 | 1.342 | 1.748 | 2.161 |
Look at the Excel graph of the scatter diagram of the (x. y') data pairs and compare this diagram with the diagram in part (a). Which graph appears to better fit a straight line?
(c) Use a calculator with regression keys to verify the linear regression equation for the (x, y) data pairs,
(d) Use a calculator with regression keys to verify the linear regression equation for the (x, y') data pairs,
(e) The exponential growth model is
Note: The TI-84Plus/TI-83Plu.s/TI-nspire calculators fully support the exponential growth model. Place the original x data in list LI and the corresponding y data in list L2. Then press STAT, followed by CALC, and scroll down to option 0: ExpReg. The output gives values for
Want to see the full answer?
Check out a sample textbook solution
Chapter 4 Solutions
Understanding Basic Statistics


- Table 2 shows a recent graduate’s credit card balance each month after graduation. a. Use exponential regression to fit a model to these data. b. If spending continues at this rate, what will the graduate’s credit card debt be one year after graduating?arrow_forwardSales of a video game released in the year 2000 took off at first, but then steadily slowed as time moved on. Table 4 shows the number of games sold, in thousands, from the years 20002010. a. Let x represent time in years starting with x=1 for the year 2000. Let y represent the number of games sold in thousands. Use logarithmic regression to fit a model to these data. b. If games continue to sell at this rate, how many games will sell in 2015? Round to the nearest thousand.arrow_forwardTable 6 shows the population, in thousands, of harbor seals in the Wadden Sea over the years 1997 to 2012. a. Let x represent time in years starting with x=0 for the year 1997. Let y represent the number of seals in thousands. Use logistic regression to fit a model to these data. b. Use the model to predict the seal population for the year 2020. c. To the nearest whole number, what is the limiting value of this model?arrow_forward

 Algebra & Trigonometry with Analytic GeometryAlgebraISBN:9781133382119Author:SwokowskiPublisher:Cengage
 Glencoe Algebra 1, Student Edition, 9780079039897...AlgebraISBN:9780079039897Author:CarterPublisher:McGraw Hill
 Trigonometry (MindTap Course List)TrigonometryISBN:9781337278461Author:Ron LarsonPublisher:Cengage Learning