
a.
Check whether there is any difference in the mean drainage times for the different channel designs or not.
a.
Answer to Problem 11SE
There is sufficient evidence to conclude that there is a significant difference in the mean drainage times with different channel type at
Explanation of Solution
Given info:
The design variable is the channel type and the response is the drainage time. The table provides the drainage time corresponding to the channel type.
Calculation:
State the hypotheses:
Null hypothesis:
Alternative hypothesis:
The ANOVA table can be obtained as follows:
Software procedure:
Step by step procedure to obtain One-Way ANOVA using the MINITAB software:
- Choose Stat > ANOVA > One-Way.
- In Response, enter the column of Drainage time.
- In Factor, enter the column of Channel type.
- In Confidence level, enter 0.95.
- Click OK.
Output using the MINITAB software is given below:
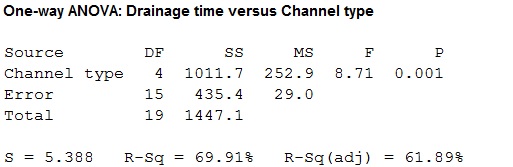
From the ANOVA table, it is clear that P-value is 0.001 and the F-value is 8.71.
Since, the level of significance is not specified; the prior level of significance
Decision:
If
If
Conclusion:
Here, the P-value is less than the level of significance.
That is,
By rejection rule, reject the null hypothesis.
There is sufficient evidence to conclude that there is a significant difference in the mean drainage times with different channel type at
b.
Identify the pairs of designs that can conclude to have differing mean drainage times.
b.
Answer to Problem 11SE
There is sufficient evidence to conclude that the channels 3 and 4 differ from channels 1,2, and 5 at
Explanation of Solution
Calculation:
State the hypotheses:
Null hypothesis:
Alternative hypothesis:
Decision:
By Tukey-Kramer method for multiple comparisons,
If
If
Here
From Appendix A table A.9, the upper 5% point of the
For comparing channel 1 and 2:
The 5% critical value is,
Substitute
The sample means are,
Now,
Which is less than 4.51.
Thus, fail to reject the null hypothesis
Hence, for channel 1 and 2 there is no difference in mean drainage times.
For comparing channel 1 and 3:
The 5% critical value is,
Substitute
The sample means are,
Now,
Which is greater than 4.51.
Thus, reject the null hypothesis
Hence, for channel 1 and 3 there is difference in mean drainage times.
For comparing channel 1 and 4:
The 5% critical value is,
Substitute
The sample means are,
Now,
Which is greater than 4.51.
Thus, reject the null hypothesis
Hence, for channel 1 and 4 there is difference in mean drainage times.
For comparing channel 1 and 5:
The 5% critical value is,
Substitute
The sample means are,
Now,
Which is less than 4.51.
Thus, fail to reject the null hypothesis
Hence, for channel 1 and 5 there is no difference in mean drainage times.
For comparing channel 2 and 3:
The 5% critical value is,
Substitute
Now,
Which is greater than 4.51.
Thus, reject the null hypothesis
Hence, for channel 2 and 3 there is difference in mean drainage times.
For comparing channel 2 and 4:
The 5% critical value is,
Substitute
Now,
Which is greater than 4.51.
Thus, reject the null hypothesis
Hence, for channel 2 and 4 there is difference in mean drainage times.
For comparing channel 2 and 5:
The 5% critical value is,
Substitute
Now,
Which is less than 4.51.
Thus, fail to reject the null hypothesis
Hence, for channel 2 and 5 there is no difference in mean drainage times.
For comparing channel 3 and 4:
The 5% critical value is,
Substitute
Now,
Which is less than 4.51.
Thus, fail to reject the null hypothesis
Hence, for channel 3 and 4 there is no difference in mean drainage times.
For comparing channel 3 and 5:
The 5% critical value is,
Substitute
Now,
Which is greater than 4.51.
Thus, reject the null hypothesis
Hence, for channel 3 and 5 there is difference in mean drainage times.
For comparing channel 4 and 5:
The 5% critical value is,
Substitute
Now,
Which is greater than 4.51.
Thus, reject the null hypothesis
Hence, for channel 4 and 5 there is difference in mean drainage times.
Conclusion:
There is sufficient evidence to conclude that the channels 3 and 4 differ from channels 1,2, and 5 at
Want to see more full solutions like this?
Chapter 9 Solutions
Statistics for Engineers and Scientists

- Repeat Example 5 when microphone A receives the sound 4 seconds before microphone B.arrow_forwardOnly b.ii, iii and iv please. The output of a solar panel (photovoltaic) system depends on its size. A manufacturer states that the average daily production of its 1.5 kW system is 6.6 kilowatt hours (kWh) for Perth conditions. A consumer group monitored this 1.5 kW system in 20 different Perth homes and measured the average daily production by the systems in these homes over a one month period during October. The data is provided here. (a) Analyse the consumer group’s data to test if the manufacturer’s claim of an average of 6.6 kWh per day is reasonable. State appropriate hypotheses, assumptions and decision rule at α = 0.10. What conclusions would you report to the consumer group? Hint: You will need to find Descriptive Statistics first.) (b) If 48 homes in the central Australian city of Alice Springs had this system installed and similar data wascollected, in order to assess whether average daily production in Alice Springs exceeded 6.6 kWh, (i) what would the alternate hypothesis…arrow_forwardOne operation of a mill is to cut pieces of steel into parts that will later be used as the frame for front seats in an automobile. The steel is cut with a diamond saw and requires the resulting parts to be within 10.005 inch of the length specified by the automobile company. Data are collected from a sample of 50 steel parts and are shown in the following table. The measurement reported is the difference in inches between the actual length of the steel part, as measured by a laser measurement device, and the specified length of the steel part. For example, the first value, -0.003, represents a steel part that is 0.003 inch shorter than the specified length. Complete parts a through c Click the icon to view the data table. a. Construct a frequency distribution Difference in Length -0.005 but less than -0.003: -0.003but less than -0.001 -0.001but less than 0.001 0.001but less than 0.003 0.003but less than 0.005 Frequency Difference Between Actual and Specified Lengths 0.002 0 -0.003…arrow_forward
- A magazine published a study on the ammonia levels near the exit ramp of a highway tunnel. The data in the table below represent daily ammonia concentrations (in parts per million) on eight randomly selected days during the afternoon drive time. Complete parts a through c.arrow_forwardRapid drainage of floodwater is crucial to prevent damage during heavy rains. Several designs for a drainage canal were considered for a certain city. Each designs was tested five times, to determinehow longit took to drain the water in a reservoir. The following table pesents the drainage times, in minutes. Channel Type Drainage Time 1 41.4 43.4 50.5 41.2 2 38.7 48.3 51.1 38.3 3 32.6 33.7 34.8 22.5 4 26.3 30.9 33.3 23.8 5 44.9 47.2 48.5 37.1 a. Construct an ANOVA table. b. Can you conclude that there is a difference in the mean drainage times for the different channel designs? use the a=0.01 level of significance.arrow_forwardIn Applied Life Data Analysis (Wiley, 1982), Wayne Nelson presents the breakdown time of an insulating fluid between electrodes at 34 kV. The times, in minutes, are as follows: 0.19, 0.78, 0.96, 1.31, 2.78, 3.16, 4.15, 4.67, 4.85, 6.50, 7.35, 8.01, 8.27, 12.06, 31.75, 32.52, 33.91, 36.71, and 72.89. Calculate the sample mean and sample standard deviation.arrow_forward
- In Applied Life Data Analysis (Wiley, 1982), Wayne Nelson presents the breakdown time of an insulating fluid between electrodes at 34 kV. The times, in minutes, are as follows: 0.28, 0.88, 0.97, 1.29, 2.65, 3.16, 4.14, 4.80, 4.88, 6.37,7.22,7.95, 8.33, 11.98, 31.84, 32.41, 33.97, 36.84, and 72.75. Construct a normal probability plot of these data. Does it seem reasonable to assume that breakdown time is normally distributed? Choose the correct answer. O Yes, breakdown time is normally distributed. O No, breakdown time is not normally distributed.arrow_forwardHoaglin, Mosteller, and Tukey (1983) presented data on blood levels of beta-endorphin as a function of stress. They took beta-endorphin levels for 19 patients 12 hours before surgery and again 10 minutes before surgery. The data are presented below, in fmol/ml Based on these date, what effect does icreased stressed have on endorphin levels. Solve by hand or SPSS. Participant 12 hours before 10 minutes before 1 10 6.5 2 6.5 14.0 3 8.0 13.5 4 12 18 5 5.0 14.5 6 11.5 9.0 7 5.0 18.0 8 3.5…arrow_forwardA dietitian wishes to see if a person’s cholesterol level will change if the diet is supplemented by a certain mineral. Five randomly selected subjects were pre-tested, and then they took the mineral supplement for a 6-week period. The Cholesterol level before and after taking the mineral supplements is shown in the table below. (Cholesterol level is measured in milligrams per deciliter). Table is attached Questions: If X1 is a normal variate with mean 2 and standard deviation 4 and X2 is a normal variate with mean 3 and standard deviation 9, then find E[X1 - 2X2] and Var(X1 - 2X2) The confidence level can be viewed as the amount of risk that an analyst will accept when making a decision (State True or False) You find a 90% confidence interval for true average thiamin content in oats for a given sample as (2.4,7.8) and you interpret the confidence interval as: I can be highly confident that 90% of the oats in the sample will have thiamin content between 2.4 and 7.8 (State True or…arrow_forward
- The output of a solar panel (photovoltaic) system depends on its size. A manufacturer states that the average daily production of its 1.5 kW system is 6.6 kilowatt hours (kWh) for Perth conditions. A consumer group monitored this 1.5 kW system in 20 different Perth homes and measured the average daily production by the systems in these homes over a one month period during October. The data is provided here. kWh 6.2, 5.8, 5.9, 6.1, 6.4, 6.3, 6.9, 5.5, 7.4, 6.7, 6.3, 6.2, 7.1, 6.8, 5.9, 5.4, 7.2, 6.7, 5.8, 6.9 1. Analyse the consumer group’s data to test if the manufacturer’s claim of an average of 6.6 kWh per day is reasonable. State appropriate hypotheses, assumptions and decision rule at α = 0.10. What conclusions would you report to the consumer group? (Hint: You will need to find Descriptive Statistics first.) 2. If 48 homes in the central Australian city of Alice Springs had this system installed and similar data was collected, in order to assess whether average daily production in…arrow_forward2. Floods: Rapid drainage of floodwater is crucial to prevent damage during heavy rains. Several designs for a drainage canal were considered for a certain city. Each design was tested five times, to determine how long it took to drain the water in a reservoir. The following table presents the drainage times, in minutes. Channel Type Drainage Time 1 41.4 43.4 50.0 41.2 2 38.7 48.3 51.1 38.3 3 32.6 33.7 34.8 22.5 4 26.3 30.9 33.3 23.8 5 44.9 47.2 48.5 37.1 a. Construct an ANOVA table. b. Can you conclude that there is a difference in the mean drainage times for the different channel designs? Use the α = 0.01 level of significance.arrow_forwardThe spotted lanternfly, Lycorma delicatula, is an invasive species to the United States that has the potential to do significant agricultural damage. An ecologist is studying the relationship between the size of the female spotted lanternflies and the number of eggs they produce. The data are summarized below. Length of insect: AVG = 1 inch, SD = 0.15 inchNumber of eggs: AVG = 40 eggs, SD = 5 eggsr = 0.2 Using regression, we can say that the average number of eggs produced by female spotted lanternflies who are 1.1 inch long is closest to... Group of answer choices 42 39 40 41arrow_forward
 Algebra & Trigonometry with Analytic GeometryAlgebraISBN:9781133382119Author:SwokowskiPublisher:Cengage
 Trigonometry (MindTap Course List)TrigonometryISBN:9781337278461Author:Ron LarsonPublisher:Cengage Learning