Financial Accounting (12th Edition) (What's New in Accounting)
12th Edition
ISBN: 9780134725987
Author: C. William Thomas, Wendy M. Tietz, Walter T. Harrison Jr.
Publisher: PEARSON
expand_more
expand_more
format_list_bulleted
Videos
Textbook Question
Chapter 9, Problem 9.21AE
(Learning Objective 5: Evaluate debt-paying ability) Companies that operate in different industries may have very different financial ratio values. These differences may grow even wider when we compare companies located in different countries.
Compare three fictitious companies (Albertson, Millstone, and Raleigh) by calculating the following ratios
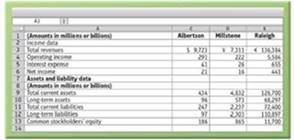
Base on your computed ratios, which company looks the Was-risky?
Expert Solution & Answer
Want to see the full answer?
Check out a sample textbook solution
Students have asked these similar questions
Imagine that you’ve been asked to explain 1 of the major accounting ratios to a group of high school students who have no background in business or accounting but are eager to learn. Choose 1 of the following ratios and describe how you would explain it in your own words, using a specific example:
current ratio
asset turnover
profit margin on sales
OBJECTIVE: To enable learners to utilize financial ratios as a mechanism to evaluate the firm's financial
performance and identify areas for making decisions for improvement
REQUIREMENT: Financial Statement Analysis
Question
Refer to the following financial statements of Delima Corporation for 2019 and 2020:
Delima Corporation
Income Statements
For the year ended 31 December (in millions)
2020
$13,198
7,750
2019
$12,397
7,108
Net sales
Cost of goods sold
Gross profit
Selling and administrative expenses
Income from operations
5,448
5,289
3,472
3,299
1,976
1,990
Interest expense
233
248
Other (income) expense, net
11
1,732
503
1,229
Income before income taxes
1,742
Income tax expense
502
Net income
1,240
Delima Corporation
Balance Sheets
31 December (in millions)
2020
2019
Assets
Current assets
Cash
$460
$444
Accounts receivables (net)
1,188
1,132
1,190
1,056
225
2,915
3,128
Inventories
Other current assets
247
Total current assets
3,027
3,281
Property (net)
5,593
$11,901
Other assets…
Selected financial data for Surf City and Paradise Falls are as follows:Required:1. Calculate the debt to equity ratio for Surf City and Paradise Falls for the most recent year. Which company has the higher ratio?2. Calculate the return on assets for Surf City and Paradise Falls. Which company appears more profitable?3. Calculate the times interest earned ratio for Surf City and Paradise Falls. Which company is better able to meet interest payments as they become due?
Chapter 9 Solutions
Financial Accounting (12th Edition) (What's New in Accounting)
Ch. 9 - Brownlee Company issued 525,000, 8%, six-year...Ch. 9 - A bond with a face value of 250,000 and a quoted...Ch. 9 - Mission Furniture issued 500,000 in bonds payable...Ch. 9 - Bonds with an 8% stated interest rate were issued...Ch. 9 - Brimfest Corporation issued 2,400,000, 10-year, 6%...Ch. 9 - The Discount on Bonds Payable account a.is an...Ch. 9 - The discount on a bond payable becomes...Ch. 9 - The carrying value of Bonds Payable equals a.Bonds...Ch. 9 - Prob. 9QCCh. 9 - Prob. 10QC
Ch. 9 - Prob. 11QCCh. 9 - When a company retires bonds early, the gain or...Ch. 9 - Which type of lease will not increase a companys...Ch. 9 - Prob. 14QCCh. 9 - The debt ratio is calculated by dividing: a. total...Ch. 9 - Prob. 16QCCh. 9 - Prob. 17QCCh. 9 - Prob. 9.1ECCh. 9 - Prob. 9.1SCh. 9 - (Learning Objective 1: Determine bond prices at...Ch. 9 - (Learning Objective 1: Journalize basic bond...Ch. 9 - Prob. 9.4SCh. 9 - Prob. 9.5SCh. 9 - Prob. 9.6SCh. 9 - Prob. 9.7SCh. 9 - Prob. 9.8SCh. 9 - (Learning Objective 2: Account for bonds payable...Ch. 9 - Prob. 9.10SCh. 9 - LO 4,5 (Learning Objectives 4, 5: Deferred income...Ch. 9 - LO 5 (Learning Objective 5: Compute and evaluate...Ch. 9 - LO 5 (Learning Objective 5: Calculate the leverage...Ch. 9 - LO 6 (Learning Objective 6: Report liabilities)...Ch. 9 - (Learning Objective 1: Issue bonds payable...Ch. 9 - Prob. 9.16AECh. 9 - Prob. 9.17AECh. 9 - LO 2 (Learning Objective 2: Issue bonds payable...Ch. 9 - Prob. 9.19AECh. 9 - LO 4 (Learning Objective 4: Account for deferred...Ch. 9 - (Learning Objective 5: Evaluate debt-paying...Ch. 9 - LO 4, 5 (Learning Objectives 4, 5: Analyze current...Ch. 9 - Prob. 9.23AECh. 9 - (Learning Objective 1: Issue bonds payable...Ch. 9 - Prob. 9.25BECh. 9 - Prob. 9.26BECh. 9 - Prob. 9.27BECh. 9 - Prob. 9.28BECh. 9 - LO 4 (Learning Objective 4: Account for deferred...Ch. 9 - Prob. 9.30BECh. 9 - Prob. 9.31BECh. 9 - Prob. 9.32BECh. 9 - A bond with a face amount of 12,000 has a current...Ch. 9 - The carrying value on bonds equals Bends Payable...Ch. 9 - Prob. 9.35QCh. 9 - Prob. 9.36QCh. 9 - Prob. 9.37QCh. 9 - Prob. 9.38QCh. 9 - Prob. 9.39QCh. 9 - Prob. 9.40QCh. 9 - Prob. 9.41QCh. 9 - Prob. 9.42QCh. 9 - Prob. 9.43QCh. 9 - Prob. 9.44QCh. 9 - Prob. 9.45QCh. 9 - Prob. 9.46QCh. 9 - Prob. 9.47QCh. 9 - Prob. 9.48QCh. 9 - Prob. 9.49QCh. 9 - Prob. 9.50APCh. 9 - (Learning Objectives 1, 6: Issue bonds at a...Ch. 9 - Prob. 9.52APCh. 9 - Prob. 9.53APCh. 9 - (Learning Objectives 2, 3, 6: Issue convertible...Ch. 9 - Prob. 9.55APCh. 9 - Prob. 9.56BPCh. 9 - Prob. 9.57BPCh. 9 - Prob. 9.58BPCh. 9 - Prob. 9.59BPCh. 9 - (Learning Objectives 2, 3, 6: Issue convertible...Ch. 9 - (Learning Objectives 4, 5, 6: Report liabilities...Ch. 9 - Prob. 9.62CEPCh. 9 - Prob. 9.63CEPCh. 9 - Prob. 9.64SCCh. 9 - (Learning Objective 5: Explore an actual...Ch. 9 - Prob. 1FF
Knowledge Booster


Learn more about
Need a deep-dive on the concept behind this application? Look no further. Learn more about this topic, accounting and related others by exploring similar questions and additional content below.Similar questions
- Companies that operate in different industries may have very different financial ratio values. These differences may grow even wider when we compare companies located in different countries. (Click the icon to view the financial statements.) Requirement Compare three leading companies on their current ratio, debt ratio, and times-interest-earned ratio. Compute three ratios for Sobeys (the Canadian grocery chain), Sony (the Japanese electronics manufacturer) and Daimler (the German auto company). Based on your computed ratio values, which company looks the least risky? Begin by computing the ratios. Start by selecting the formula for the current ratio. Then, calculate the current ratios for Sobeys, Sony, and Daimler. (Enter amounts in millions or billions as provided to you in the problem statement. Round the current ratios to two decimal places.) 1 Sobeys Sony Daimler Sobeys Sony 1 Soboys Sony Daimler 1 Next, select the formula for the debt ratio. Then, calculate the debt ratios for…arrow_forwardIf given the opportunity, in which of the firms would you invest based on the result of your analysis of both companies and the comparison with the industry? If you would not invest, explain your reasons according to the results obtained. Company Name: Year 2018 Chemicals and Allied Products Industry Ratios ………….. Solvency or Debt Ratios Merck J&J 2018 Debt ratio 0.67 0.61 0.47 Debt-to-equity ratio 0.93 0.51 0.38 Interest coverage ratio 12.27 18.91 -9.43 Liquidity Ratios Current ratio 1.17 1.47 3.47 Quick ratio 0.92 1.16 2.12 Cash ratio 0.40 0.63 2.24 Profitability Ratios Profit margin 14.64% 18.75% -93.4% ROE (Return on equity), after tax 23.03% 25.60% -248.5 ROA (Return on assets) 7.49% 10.00% -146.5 Gross margin 68.06% 66.79% 55.3% Operating margin (Return on sales) 19.62% 24.27%…arrow_forwardIn a minimum of 175 words Imagine that you’ve been asked to explain 1 of the major accounting ratios to a group of high school students who have no background in business or accounting but are eager to learn. Choose 1 of the following ratios and describe how you would explain it in your own words, using a specific example: current ratio asset turnover profit margin on salesarrow_forward
- Selected financial data for Bahama Bay and Caribbean Key are as follows:Required:1. Calculate the debt to equity ratio for Bahama Bay and Caribbean Key for the most recent year. Which company has the higher ratio?2. Calculate the return on assets for Bahama Bay and Caribbean Key. Which company appears more profitable?3. Calculate the times interest earned ratio for Bahama Bay and Caribbean Key. Which company is better able to meet interest payments as they become due?arrow_forwardUse for financial statements for Yellow Hammer to answer problems 1-3 1. Assess Yellow Hammer's income statement by calculating the sales growth, EBITDA profitability (EBITDA/Sales) and coverage ratios using EBIT and EBITDA for each year. 2. Assess Yellow Hammer's balance sheet by calculating the leverage ratios using of Debt/Capitalization and Debt/EBITDA. 3. Using the table below and the ratios that you've calculated, insert the EBIT interest coverage, EBITDA interest coverage, Debt/EBITDA and Debt to Capitalization and then provide an assessment of Yellow Hammer's credit quality. Oper. income (bef. D&A)/revenues (%) Return on capital (%) EBIT interest coverage (x) EBITDA interest coverage (x) FFO/debt (%) Free oper. cash flow/debt (%) Disc. cash flow/debt (%) Debt/EBITDA (x) Debt/debt plus equity (%) AA 32.1 19.7 13.1 17.9 72.3 43.9 18.3 1.0 21.0 A 19.1 16.8 8.1 11.6 53.0 28.4 10.6 1.4 32.1 BBB 17.1 12.0 4.5 7.1 34.5 15.5 6.9 2.1 42.2 BB 20.4 9.5 3.0 4.9 24.0 9.0 3.9 2.9 47.4 B 15.3…arrow_forwardYour Task… Using your assigned financial statements calculate the required ratios below Indicate if the change from year to year is favorable or unfavorable. All values should be accurate to at least two decimal places. The expectation is to submit a professional report free of grammar and spelling errors and easy to read. Think of this as a menu you would be handing to a customer. All calculations are to be represented. Analysis of Profitability Gross Profit Ratio Operating Profit Ratio Net Profit Ratio Sales to Total Assets Ratio Return on Total Assets Return on Equity Earnings Per Sharearrow_forward
- Compare and contrast the four categories of financial ratios we discussed in class. Discuss how the business owners and potential investors could benefit from these ratios. What are clear indicators of success vs. poor operations?arrow_forwardHere you will find some income statements and balance sheets for Sears Holdings (SHLD) and Taget Corp (TGT). Assume that you are a financial manager at Sear and want to compare your firm’s situation with that of Target. Calculate represenatative ratios for liquidity, asset management efficiency, financial leverage (capital structure), and profitability for both Sears and Target. How would you summarize the financial performance of Sears compared to target (its benchmark firm)? Include Sears and Targets current ratio, acid-test ratio, average collection period, accounts receivable turnover, inventory turnover, debt ratio, timed interest earned, total asset turnover, fixed asset turnover, gross profit margin, operating profit margin, net profit margin, operating return on assets, and return on equity.arrow_forwardGrammatico Company has just completed its third year of operations. The income statement is as follows: Selected information from the balance sheet is as follows: Required: Note: Round answers to two decimal places. 1. Compute the times-interest-earned ratio. 2. Compute the debt ratio. 3. CONCEPTUAL CONNECTION Assume that the lower quartile, median, and upper quartile values for debt and times-interest-earned ratios in Grammaticos industry are as follows: How does Grammatico compare with the industrial norms? Does it have too much debt?arrow_forward
- You have been asked by your CEO to evaluate, analyze and calculate commonly used ratios relating to a company’s profitability, liquidity, solvency and management efficiency. Requirement: Complete the balance sheet and sales data (fill in the blanks), using the following financial data: Debt/net worth 60% x 37,000 = 22,200 (debt) = AP Acid test ratio 1.2 x 22,200 = 26,640 Asset turnover 1.5 times Day sales outstanding in accounts receivable 40 days Gross profit margin 30% Inventory turnover 6 times Balance sheet Cash…arrow_forwarda)Please calculate the all ratios of companies - Profitability ratios(Profit margin, Return on assets ,Return on equity) Asset utilization ratios (Receivables turnover, Average collection period, Inventory turnover, Fixed asset turnover, Total asset turnover) Liquidity ratios (Current ratio, Quick ratio) & Debt utilization ratios (Debt total assets, Times interest earned, Fixed charge coverage) b) Calculate all your ratios in and Excel File. You need to show all your calculations in excel file but use the calculated value in your main report. [Note:The answer should be based on "Canadian national railway annual report 2016 and 2017"]arrow_forwardSee Image for Information Compute the following performance indices for both companies: Profit margin Asset turnover Return on Capital Employed (ROCE) Current ratio Debt equity ratio Compare and analyse the performance of the two companies computed in (1) above and explain what the board of Box Limited needs to do to achieve their objective . c. Which other non-financial measures can influence the decision of the board of Box Limited?arrow_forward
arrow_back_ios
SEE MORE QUESTIONS
arrow_forward_ios
Recommended textbooks for you
 Managerial Accounting: The Cornerstone of Busines...AccountingISBN:9781337115773Author:Maryanne M. Mowen, Don R. Hansen, Dan L. HeitgerPublisher:Cengage Learning
Managerial Accounting: The Cornerstone of Busines...
Accounting
ISBN:9781337115773
Author:Maryanne M. Mowen, Don R. Hansen, Dan L. Heitger
Publisher:Cengage Learning
Financial ratio analysis; Author: The Finance Storyteller;https://www.youtube.com/watch?v=MTq7HuvoGck;License: Standard Youtube License