Fundamentals Of Financial Accounting
6th Edition
ISBN: 9781259864230
Author: PHILLIPS, Fred, Libby, Robert, Patricia A.
Publisher: Mcgraw-hill Education,
expand_more
expand_more
format_list_bulleted
Videos
Textbook Question
Chapter 3, Problem 23ME
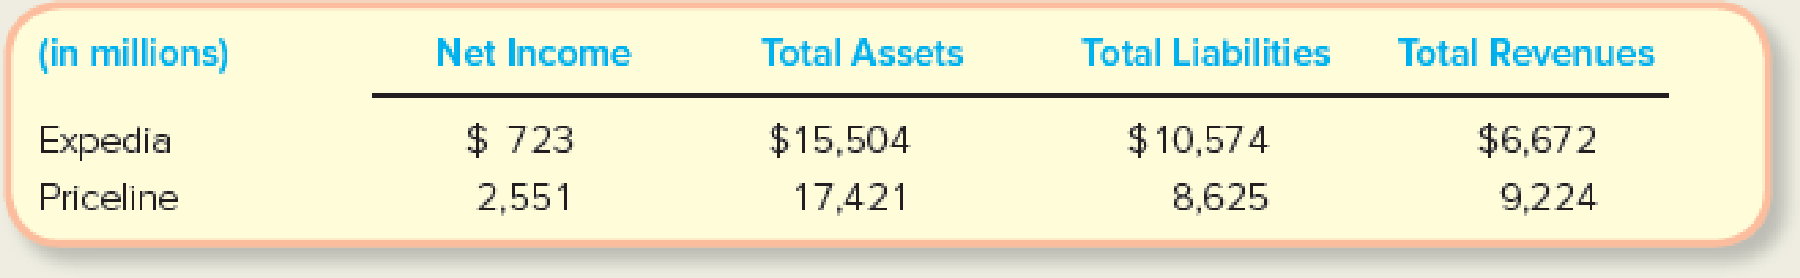
Calculating and Interpreting Net Profit Margin
Expedia and Priceline compete as online travel agencies. Historically, Expedia has focused more on flights, whereas Priceline has focused on hotel bookings. The following amounts were reported by the two companies in 2015. Calculate each company’s net profit margin expressed as a percent (to one decimal place). Which company has generated a greater return of profit from each revenue dollar?
Expert Solution & Answer
Want to see the full answer?
Check out a sample textbook solution
Students have asked these similar questions
Use the following information for Short Exercises S15-6 through S15-10.
Accel’s Companies, a home improvement store chain, reported the following summarized figures:
Requirements
Compute the profit margin ratio for Accel’s Companies for 2018.
Compute the rate of return on total assets for 2018.
Here is the condensed statement of financial performance of the three companies for the year
ended December 31, 2014. Solve for the profitability ratio.
JFC
Petron
Globe
Sales Revenue
90,671
482,535
103,235
Cost of Sales/Service
(73,728)
(463,100)
(10,661)
Gross Margin
16,943
19,435
92,574
Operatir.g Expenses
(10,806) (11,830.00)
(59,506)
Operating Profit
6,137
7,605
33,068
Other Income
748
1,736
1,255
Other Expenses
(126)
(5,528)
(14,940)
Net Iricome before Tax
6,759
3,813
19,383
Income Tax
(1,271)
(804)
(6,011)
Not Income after Tax
5,488
3,009
13,372
2. Compare the three companies using the ratios computed.
3. What are the possible reasons why the sample companies have different ratios. What
could have possibly caused these differences? What are the implications?
Compare Delta to two of its competitors, JetBlue and Southwest, by answering the following questions. You do not need to calculate all of the ratios for JetBlue and Southwest, only the ones required to answer the questions below:
How much bigger is Delta from each of its competitors, by Revenue, in each year from 2018-2022? Plot the Revenue number for each company for these years on a single line graph.
Which company has the highest Net Income in each year from 2018-2022?
Which company has the highest Net Profit Margin in 2018? In 2022?
Which company is the most profitable based on Gross Profit percentage each year from 2018-2022? (This is a trick question.)
Which company is best at using its short-term assets to pay off its short-term liabilities in 2019? Which company has the best cash ratio in 2019? Is it the same company that is best at using its short-term assets to pay short-term liabilities? If not, why do you think it's different?
Which company is the most leveraged in 2022?
Chapter 3 Solutions
Fundamentals Of Financial Accounting
Ch. 3 - Prob. 1QCh. 3 - When accounting was developed in the 14th and 15th...Ch. 3 - Define accrual basis accounting and contrast it...Ch. 3 - Prob. 4QCh. 3 - What two questions are answered by the core...Ch. 3 - Prob. 6QCh. 3 - What is a performance obligation?Ch. 3 - How do you report revenue from a contract that...Ch. 3 - Explain the expense recognition principle...Ch. 3 - Explain why stockholders equity is increased by...
Ch. 3 - Explain why revenues are recorded as credits and...Ch. 3 - Complete the following table by entering either...Ch. 3 - Complete the following table by entering either...Ch. 3 - Prob. 14QCh. 3 - Prob. 15QCh. 3 - What is the difference between Accounts Receivable...Ch. 3 - What is the difference between Accounts Payable...Ch. 3 - For each of the following situations, indicate...Ch. 3 - Prob. 19QCh. 3 - Which of the following items is not a specific...Ch. 3 - Which of the following accounts normally has a...Ch. 3 - Prob. 3MCCh. 3 - Which of the following would the core revenue...Ch. 3 - If a company incorrectly records a payment as an...Ch. 3 - Prob. 6MCCh. 3 - Prob. 7MCCh. 3 - Which account is least likely to be debited when...Ch. 3 - Webby Corporation reported the following amounts...Ch. 3 - Which of the following is the entry to be recorded...Ch. 3 - Identifying Performance Obligations Lakeside...Ch. 3 - Prob. 2MECh. 3 - Identifying Accrual Basis Revenues The following...Ch. 3 - Identifying Accrual Basis Expenses The following...Ch. 3 - Recording Accrual Basis Revenues For each of the...Ch. 3 - Recording Accrual Basis Expenses For each of the...Ch. 3 - Prob. 7MECh. 3 - Prob. 8MECh. 3 - Prob. 9MECh. 3 - Prob. 10MECh. 3 - Identifying Accrual Basis Expenses The following...Ch. 3 - Prob. 12MECh. 3 - Recording Accrual Basis Expenses For each of the...Ch. 3 - Prob. 14MECh. 3 - Preparing Accrual Basis Journal Entries for...Ch. 3 - Preparing Accrual Basis Journal Entries for...Ch. 3 - Preparing Accrual Basis Journal Entries and...Ch. 3 - Determining the Accounting Equation Effects of...Ch. 3 - Prob. 19MECh. 3 - Preparing an Income Statement and Calculating Net...Ch. 3 - Preparing Financial Statements from a Trial...Ch. 3 - Preparing an Income Statement and Calculating Net...Ch. 3 - Calculating and Interpreting Net Profit Margin...Ch. 3 - Calculating and Interpreting Net Profit Margin...Ch. 3 - Matching Definitions with Terms Match each...Ch. 3 - Matching Definitions with Terms Match each...Ch. 3 - Identifying Performance Obligations and Timing...Ch. 3 - Identifying Accrual Basis Revenues According to...Ch. 3 - Identifying Accrual Basis Revenues According to...Ch. 3 - Identifying Accrual Basis Expenses Under accrual...Ch. 3 - Identifying Accrual Basis Expenses Under accrual...Ch. 3 - Determining Accounting Equation Effects and Net...Ch. 3 - Determining Accounting Equation Effects and Net...Ch. 3 - Recording Journal Entries and Determining Net...Ch. 3 - Prob. 11ECh. 3 - Recording Journal Entries and Determining Net...Ch. 3 - Recording and Posting Accrual Basis Journal...Ch. 3 - Analyzing Transactions from the Perspectives of...Ch. 3 - Prob. 15ECh. 3 - Determining Accounting Equation Effects of Several...Ch. 3 - Preparing Journal Entries For each of the...Ch. 3 - Prob. 18ECh. 3 - Creating an Unadjusted Trial Balance Based on the...Ch. 3 - Inferring Transactions, Creating Financial...Ch. 3 - Determining the Effects of Various Transactions EZ...Ch. 3 - COACHED PROBLEMS Recording Nonquantitative Journal...Ch. 3 - Prob. 2CPCh. 3 - Prob. 3CPCh. 3 - Prob. 4CPCh. 3 - Prob. 1PACh. 3 - Recording Journal Entries Diana Mark is the...Ch. 3 - Analyzing the Effects of Transactions Using...Ch. 3 - Prob. 4PACh. 3 - Prob. 1PBCh. 3 - Prob. 2PBCh. 3 - Analyzing the Effects of Transactions Using...Ch. 3 - Analyzing, Journalizing, and Interpreting Business...Ch. 3 - Prob. 1COPCh. 3 - Finding Financial Information Refer to the...Ch. 3 - Comparing Financial Information Refer to the...Ch. 3 - Prob. 4SDCCh. 3 - Ethical Decision Making: A Mini-Case Mike Lynch is...Ch. 3 - Accounting for Business Operations Starting in...
Knowledge Booster


Learn more about
Need a deep-dive on the concept behind this application? Look no further. Learn more about this topic, accounting and related others by exploring similar questions and additional content below.Similar questions
- The following revenue data were taken from the December 31, 2017, Coca-Cola annual report (10-K): For each segment and each year, calculate intersegment sales (another name for transfer sales) as a percentage of total sales, Using Microsoft Excel or another spreadsheet application, create a clustered column graph to show the 2016 and 2017 percentages for each division. Comment on your observations of this data. How might a division sales manager use this data?arrow_forwardReview the select information for Liquor Plaza and Beer Buddies (industry competitors) and complete the following. A. Compute the accounts receivable turnover ratios for each company for 2018 and 2019. B. Compute the number of days sales in receivables ratios for each company for 2018 and 2019. C. Determine which company is the better investment and why. Round answers to two decimal places.arrow_forwardReview the select information for Bean Superstore and Legumes Plus (industry competitors), and then complete the following. A. Compute the accounts receivable turnover ratios for each company for 2018 and 2019. B. Compute the number of days sales in receivables ratios for each company for 2018 and 2019. C. Determine which company is the better investment and why. Round answers to two decimal places.arrow_forward
- Common-size financial statements. Prepare common-size income statements for Walmart and Starbucks using the January 2015 and September 2014 information in the popup window: Which company is doing a better job of getting sales dollars to net income? Where is the one company having an advantage over the other company in turning revenue into net income? Complete the table below. (Round to two decimal places. Net income to three decimal places.) Abbreviated Income Statements ($ in Millions) Company Account Walmart, Inc. 1/31/2015 Starbucks 9/30/2014 Sales 491,920 % 16,801 % Cost of goods sold $ -370,530 % 7,272 % Selling, general, and administrative expenses $ -94,693 % $ -11,569 % EBIT $ 26,697 % $ -2,040 % Interest expense S -2,343 % $ -26 % Taxes $ -9,011 % 764 % Net income $ 15,343 % -1,302 % Which company is doing a better job of getting sales dollars to net income? (Select from the drop-down menus.) Walmart and Starbucks bring and cents of sales revenue to the bottom line,…arrow_forwardComparing Income Statements and Balance Sheets of CompetitorsFollowing are selected income statement and balance sheet data from two retailers: Abercrombie & Fitch (clothing retailer in the high-end market) and TJX Companies (clothing retailer in the value-priced market). (a) Express each income statement amount as a percentage of sales. Round your answers to one decimal place (ex: 0.2345 = 23.5%). Income Statement ($ millions) ANF TJX Sales $4,680 $21,058 Cost of goods sold 1,599 Answer 16,021 Answer Gross profit 3,081 Answer 5,037 Answer Total expenses 2,435 Answer 4,003 Answer Net income $ 646 Answer $ 1,034 Answer (b) Express each balance sheet amount as a percentage of total assets. Round your answers to one decimal place (ex: 0.2345 = 23.5%). Balance Sheet ($ millions) ANF TJX Current assets $1,010 Answer $3,929 Answer Long-term assets 1,627 Answer 2,608 Answer Total assets…arrow_forwardAnalyze the financials for Wal-Mart and its competitor(s) in the online market in 2012 and 2016. What do you conclude from analyzing financial ratios about the companies strategies and Walmart's competitive advantage? Revenue Cost of goods sold Gross profit SG&A and other expenses Operating income Net income Total assets Total liabilities Total equity Total assets end Total assets beginning Total liabilities end Total liabilities beginning Total equity end Total equity beginning Cost of goods sold as % of sales Gross margin SG&A as % of sales Operating income margin Net profit margin Asset turnover ROA ROE Walmart 2012 in $ millions 443,854 335,127 108,727 85,265 23,462 15,699 186,931 113,021 73,910 193,406 180,455 117,241 108,800 76,165 71,655 75.5% 24.5% 19.2% 5.3% 3.5% 2.4 8.4% 21.2% Walmart 2016 in $ millions 478,614 360,984 117,630 97,041 20,589 14,694 201,536 116,762 84,774 199,581 203,490 115,970 117,553 83,611 85,937 75.4% 24.6% 20.3% 4.3% 3.1% 2.4 7.3% 17.3% Amazon 2012 in $…arrow_forward
- Two companies have the financial information shown below. Requirements: Calculate the Gross Margin Percentage for each company. Calculate the Net Income Percentage for each company. From these ratios, what type of business do you think Yuri and Zuri might be? Yuri Zuri Net Sales 450,000 785,000 Cost of Goods Sold 261,000 698,000 Operating Expenses 67,500 45,200arrow_forwardBelow are several financial statement items for fiscal year 2013 for two grocery chains, Whole Foods Market, an upscale organic grocer, and The Kroger Co., a mainstream grocer. ($ millions) a. Calculate each company's return on assets (ROA) and return on equity (ROE). Comment on any differences you observe. b. Disaggregate the ROA for each company into profit margin (PM) and asset turnover (AT). Explain why Whole Foods has a higher ROA, is it because of PM or AT or both? Whole Foods Market The Kroger Co. $1,508 Net income $551 12,917 5,416 96,751 24,064 Sales Average assets Average stockholders' equity 3,840 4,090arrow_forwardCompute profit margin for each of the 3 separate companies. Which company is the most profitable based on the profit margin ratio? Net income Net sales Total assets Kerr $ 6,450 43,000 48,000 Jax $ 1,640 41,000 45,000 Profit Margin Conclusion Bron $ 3,420 38,000 43,000 Complete this question by entering your answers in the tabs below. Compute profit margin for each of the 3 separate companies. Company Profit Margin (%) Kerr Jax Bronarrow_forward
- A Dubai based company has sales of Aed 5,652,800, Cost of Goods sold of Aed 4,172,860 and Admin and General Expenses of Aed 752,600. Calculate the Gross Profit and Net Profit of the company. Also calculate the Profitability Ratio. Ontiarrow_forwardIdentify the ratio that is relevant to answering each of the following questions.a. How much net income does the company earn from each dollar of sales?b. Is the company financed primarily by debt or equity?c. How many dollars of sales were generated for each dollar invested in fixed assets?d. How many days, on average, does it take the company to collect on credit sales made tocustomers?e. How much net income does the company earn for each dollar owners have invested in it?f. Does the company have sufficient assets to convert into cash for paying liabilities as theycome due in the upcoming year?arrow_forwardWhat is the comparison (analysis) of the Days Sales Outstanding of Industry Average Ratio and the Company A Ratio? The Days Sales Outstanding has decreased and increased. Why? Industry Average DSO 2015: 138 days 2016: 104 days 2017: 173 days 2018: 125 days 2019: 98 days Company A DSO 2015: 245 days 2016: 338 days 2017: 332 days 2018: 169 days 2019: 81 daysarrow_forward
arrow_back_ios
SEE MORE QUESTIONS
arrow_forward_ios
Recommended textbooks for you
 Principles of Accounting Volume 1AccountingISBN:9781947172685Author:OpenStaxPublisher:OpenStax College
 Cornerstones of Financial AccountingAccountingISBN:9781337690881Author:Jay Rich, Jeff JonesPublisher:Cengage Learning
- Principles of Accounting Volume 2AccountingISBN:9781947172609Author:OpenStaxPublisher:OpenStax College
Principles of Accounting Volume 1
Accounting
ISBN:9781947172685
Author:OpenStax
Publisher:OpenStax College
Cornerstones of Financial Accounting
Accounting
ISBN:9781337690881
Author:Jay Rich, Jeff Jones
Publisher:Cengage Learning
Principles of Accounting Volume 2
Accounting
ISBN:9781947172609
Author:OpenStax
Publisher:OpenStax College
Topic 6 - Financial statement analysis; Author: drdavebond;https://www.youtube.com/watch?v=uUnP5qkbQ20;License: Standard Youtube License