
Videos
The article “Reaction Modeling and Optimization Using Neural Networks and Genetic Algorithms: Case Study Involving TS-1-Catalyzed Hydroxylation of Benzene” (S. Nandi, P. Mukherjee, et al., Industrial and Engineering Chemistry Research, 2002:2159–2169) presents benzene conversions (in mole percent) for 24 different benzenehydroxylation reactions. The results are
52.3 41.1 28.8 67.8 78.6 72.3 9.1 19.0
30.3 41.0 63.0 80.8 26.8 37.3 38.1 33.6
14.3 30.1 33.4 36.2 34.6 40.0 81.2 59.4.
- a. Can you conclude that the mean conversion is less than 45? Compute the appropriate test statistic and find the P-value.
- b. Can you conclude that the mean conversion is greater than 30? Compute the appropriate test statistic and find the P-value.
- c. Can you conclude that the mean conversion differs from 55? Compute the appropriate test statistic and find the P-value.
a.
Check whether there is evidence to conclude the mean conversion is less than 45.
Answer to Problem 3E
There is no evidence to conclude that the mean conversion is less than 45.
Explanation of Solution
Given info:
The data represents the benzene conversions (in mole percent) for 24 different benzene hydroxylation reactions.
Calculation:
State the test hypotheses.
Null hypothesis:
Alternative hypothesis:
Here, the sample size is large. That is, n = 24.
The formula for z-score is,
The positive and negative ranks are calculated as follows:
| x | Signed ranks | |
| 52.3 | 7.3 | 5 |
| 41.1 | –3.9 | –1 |
| 28.8 | –16.2 | –14 |
| 67.8 | 22.8 | 17 |
| 78.6 | 33.6 | 21 |
| 72.3 | 27.3 | 19 |
| 9.1 | –35.9 | –23 |
| 19 | –26 | –18 |
| 30.3 | –14.7 | –12 |
| 41 | –4 | –2 |
| 63 | 18 | 15 |
| 80.8 | 35.8 | 22 |
| 26.8 | –18.2 | –16 |
| 37.3 | –7.7 | –6 |
| 38.1 | –6.9 | –4 |
| 33.6 | –11.4 | –9 |
| 14.3 | –30.7 | –20 |
| 30.1 | –14.9 | –13 |
| 33.4 | –11.6 | –10 |
| 36.2 | –8.8 | –7 |
| 34.6 | –10.4 | –8 |
| 40 | –5 | –3 |
| 81.2 | 36.2 | 24 |
| 59.4 | 14.4 | 11 |
From the table, the sum of positive ranks is,
The test statistic is calculated as follows:
Thus, the test statistic is –0.46.
P-value:
Software Procedure:
Step-by-step procedure to obtain the P- value using the MINITAB software:
- Choose Graph > Probability Distribution Plot choose View Probability > OK.
- From Distribution, choose ‘Normal’ distribution.
- Click the Shaded Area tab.
- Choose X Value and Left Tail for the region of the curve to shade.
- Enter the data value as –0.46.
- Click OK.
Output using the MINITAB software is given below:
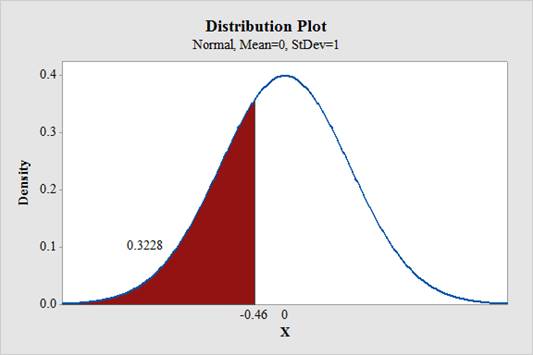
From the MINITAB output, the P-value is 0.3228.
Decision rule:
If
If
Conclusion:
Here, the P-value is greater than the level of significance, 0.05.
Therefore, the null hypothesis is not rejected.
Hence, there is no evidence to conclude that the mean conversion is less than 45.
b.
Check whether there is evidence to conclude that the mean conversion is greater than 30.
Answer to Problem 3E
There is evidence to conclude that the mean conversion is greater than 30.
Explanation of Solution
Calculation:
State the test hypotheses.
Null hypothesis:
Alternative hypothesis:
The positive and negative ranks are calculated as follows:
| x | Signed ranks | |
| 52.3 | 22.3 | 17 |
| 41.1 | 11.1 | 14 |
| 28.8 | –1.2 | –3 |
| 67.8 | 37.8 | 20 |
| 78.6 | 48.6 | 22 |
| 72.3 | 42.3 | 21 |
| 9.1 | –20.9 | –16 |
| 19 | –11 | –12.5 |
| 30.3 | 0.3 | 2 |
| 41 | 11 | 12.5 |
| 63 | 33 | 19 |
| 80.8 | 50.8 | 23 |
| 26.8 | –3.2 | –4 |
| 37.3 | 7.3 | 9 |
| 38.1 | 8.1 | 10 |
| 33.6 | 3.6 | 6 |
| 14.3 | –15.7 | –15 |
| 30.1 | 0.1 | 1 |
| 33.4 | 3.4 | 5 |
| 36.2 | 6.2 | 8 |
| 34.6 | 4.6 | 7 |
| 40 | 10 | 11 |
| 81.2 | 51.2 | 24 |
| 59.4 | 29.4 | 18 |
From the table, the sum of positive ranks is,
The test statistic is calculated as follows:
Thus, the test statistic is 2.84.
P-value:
Software Procedure:
Step-by-step procedure to obtain the P- value using the MINITAB software:
- Choose Graph > Probability Distribution Plot choose View Probability > OK.
- From Distribution, choose ‘Normal’ distribution.
- Click the Shaded Area tab.
- Choose X Value and Right Tail for the region of the curve to shade.
- Enter the data value as 2.84.
- Click OK.
Output using the MINITAB software is given below:
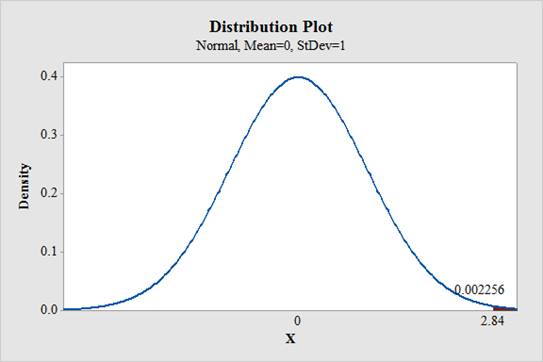
From the MINITAB output, the P-value is 0.0023.
Conclusion:
Here, the P-value is less than the level of significance, 0.05.
Therefore, the null hypothesis is rejected.
Hence, there is evidence to conclude that the mean conversion is greater than 30.
c.
Check whether there is evidence to conclude that the mean conversion differs from 55.
Answer to Problem 3E
There is evidence to conclude that the mean conversion differs from 55.
Explanation of Solution
Calculation:
State the test hypotheses.
Null hypothesis:
Alternative hypothesis:
The positive and negative ranks are calculated as follows:
| x | Signed ranks | |
| 52.3 | –2.7 | –1 |
| 41.1 | –13.9 | –5 |
| 28.8 | –26.2 | –19.5 |
| 67.8 | 12.8 | 4 |
| 78.6 | 23.6 | 15 |
| 72.3 | 17.3 | 9 |
| 9.1 | –45.9 | –24 |
| 19 | –36 | –22 |
| 30.3 | –24.7 | –16 |
| 41 | –14 | –6 |
| 63 | 8 | 3 |
| 80.8 | 25.8 | 18 |
| 26.8 | –28.2 | –21 |
| 37.3 | –17.7 | –10 |
| 38.1 | –16.9 | –8 |
| 33.6 | –21.4 | –13 |
| 14.3 | –40.7 | –23 |
| 30.1 | –24.9 | –17 |
| 33.4 | –21.6 | –14 |
| 36.2 | –18.8 | –11 |
| 34.6 | –20.4 | –12 |
| 40 | –15 | –7 |
| 81.2 | 26.2 | 19.5 |
| 59.4 | 4.4 | 2 |
From the table, the sum of positive ranks is,
The test statistic is calculated as follows:
Thus, the test statistic is –2.27.
P-value:
Software Procedure:
Step-by-step procedure to obtain the P- value using the MINITAB software:
- Choose Graph > Probability Distribution Plot choose View Probability > OK.
- From Distribution, choose ‘Normal’ distribution.
- Click the Shaded Area tab.
- Choose X Value and Both Tail for the region of the curve to shade.
- Enter the data value as –2.27.
- Click OK.
Output using the MINITAB software is given below:
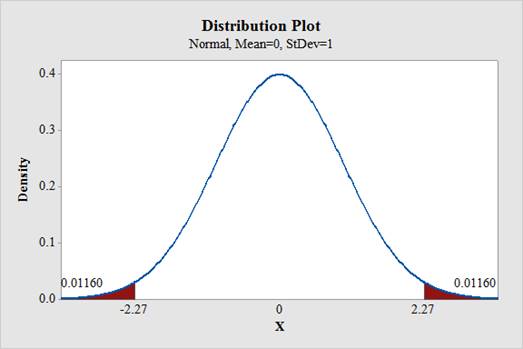
From the MINITAB output, the P-value for two tailed test is,
Conclusion:
Here, the P-value is less than the level of significance, 0.05.
Therefore, the null hypothesis is rejected.
Hence, there is evidence to conclude that the mean conversion differs from 55.
Want to see more full solutions like this?
Chapter 6 Solutions
Statistics for Engineers and Scientists
Additional Math Textbook Solutions
Elementary Statistics: A Step By Step Approach
Elementary Statistics (13th Edition)
Essentials of Statistics (6th Edition)
Research Methods for the Behavioral Sciences (MindTap Course List)
Basic Business Statistics, Student Value Edition (13th Edition)


- & The accompanying table gives plasma epinephrine concentration for ten experimental subjects during (1) isoflurane, (2) halothane, and (3) cyclopropane anesthesia ("Sympathoadrenal and Hemodynamic Effects of Isoflurane, Halothane, and Cyclopropane in Dogs." Anesthesiology, 1974: 465-470). a. Does the choice of anesthetic affect true average concentration? Test H: a, = a, = a, = 0 at level .05 after constructing the ANOVA table. %3D Subject (B) 2 3 4 5 .51 1.00 .39 28 .39 29 Anesthetic 38 .21 2 .30 3 1.07 1.35 .63 (A) .69 .28 1.24 6. 7 8 10 33 17 .32 .56 1.02 .69 .32 .39 1 .36 Anesthetic 2 .88 51 .42 (A) 3 1.53 49 .30 ΣΣή-13.7980arrow_forwardThe article “Reaction Modeling and Optimization Using Neural Networks and Genetic Algorithms: Case Study Involving TS-1-Catalyzed Hydroxylation of Benzene” (S. Nandi, P. Mukherjee, et al., Industrial and Engineering Chemistry Research, 2002:2159–2169) presents benzene conversions (in mole percent) for 24 different benzenehydroxylation reactions. The results are 52.3 41.1 28.8 67.8 78.6 72.3 9.1 19.0 30.3 41.0 63.0 80.8 26.8 37.3 38.1 33.6 14.3 30.1 33.4 36.2 34.6 40.0 81.2 59.4. a) Can you conclude that the mean conversion is less than 45? Compute the appropriate test statistic and find the P-value. b) Can you conclude that the mean conversion is greater than 30? Compute the appropriate test statistic and find the P-value. c) Can you conclude that the mean conversion differs from 55? Compute the appropriate test statistic and find the P-value.arrow_forwardThe article "Factorial Experiments in the Optimization of Alkaline Wastewater Pretreatment" (M. Prisciandaro, A. Del Borghi, and F. Veglio, Industrial Engineering and Chemistry Research, 2002:5034-5041) presents the results of an experiment to investigate the effects of the concentrations of sulfuric acid (H,So,) and calcium chloride (CaCl,) on the amount of black mud precipitate in the treatment of alkaline wastewater. There were three levels of each concentration, and two replicates of the experiment were made at each combination of levels. The results are presented in the following table (all measurements are in units of kg/m). H;5O, CaCl, 15 Precipitate 100.2 110 98.2 110 30 175.8 216.5 176.2 110 45 206.0 123 15 110.5 105.5 123 30 45 184.7 189.0 123 234.0 222.0 136 15 106.5 107.0 136 30 1817 189.0 136 45 211.8 201.3 a Construct an ANOVA table. You may give ranges for the P-values. b. Is the additive model plausible? Explain. c. Can you concude that H,S0, concentration affects the…arrow_forward
- please help me out. show full working out for better understanding Hereditary hemochromatosis (HH) is a recessively inherited genetic disorder resulting from mutations in the HFE gene. There are several possible mutations of different degrees of importance but the disease expresses itself only when at least 2 arepresent in any one individual. A blood analysis was performed on 3,000 blood samples from newborn babies of Caucasian descent in the state of Michigan, USA. The results showed that 163 of those sampled carried two mutations in the HFE gene. a. What is the proportion in the sample that carry the two mutations of the HFE gene? b. Calculate the 95% confidence interval for the proportion of this population that carries two mutations in the HFE Check the data for the necessary conditions and show full working. c. Interpret your interval in context d. If the researcher wanted to halve (x ½) the margin of error in the confidence interval found, what sample size would be required…arrow_forwardSuppose a study investigated the effects of vitamin A, vitamin C, and omega-3 fatty acids supplements on improving eye health and vision. 300 adults volunteered to take part in the study. In the study, participants were randomly assigned to one of 3 different levels of Vitamin A (Level A, Level B, or Level C) and randomly assigned to one of 2 different levels of Vitamin C (Level 1 or Level 2) and randomly assigned to one of 2 different levels of omega-3 fatty acid (Level I or Level II). a. Identify the subjects of the study. b. Identify the factor(s) for the study and the number of treatment level(s) for each factor. c. How many different treatment groups are there in this study?arrow_forwardA cohort study is conducted to assess the association between clinical characteristics and the risk of stroke. The study involves n = 1370 participants who are free of stroke at the study start. Each participant is assessed at study start (baseline) and every year thereafter for 5 years. The following data were collected relating hypertensive status measured at baseline to incident stroke over 5 years. Free of Stroke at 5 years Stroke Baseline: Not hypertensive 1000 50 Baseline: Hypertensive 300 520 Compute the cumulative incidence of stroke in patients classified as hypertensive at baseline.A)0.20B)0.50C)0.0625D)0.05 I followed the directions as shown in a similar question 20/70 patients with hypertension and stroke divided by patients with stroke however, I do not come up with a correct answerarrow_forward
- One of the issues facing organizations is increasing diversity throughout an organization. One of the ways to evaluate an organi- zation's success at increasing diversity is to compare the percentage of employees in the organization in a particular position with a specific background to the percentage in a particular position with that specific background in the general workforce. Recently, a large academic medical center determined that 9 of 17 employees in a particular position were female, whereas 55% of the employees for this position in the general workforce were female. At the 0.05 level of significance, is there evidence that the proportion of females in this position at this medical center is different from would be expected in the general workforce?arrow_forward7. A paper in Quality Engineering [2013, Vol. 25(1)] presented data on cycles to failure of solder joints at different temperatures for different types of printed circuit boards (PCB). Failure data for two temperatures (20 and 60°C) for a coppernickel-gold PCB follow. 20°C 218, 265, 279, 282, 336, 469, 496, 507, 685, 685 60°C 185, 242, 254, 280, 305, 353, 381, 504, 556, 697 a. Test the null hypothesis at x = 0.05 that the cycles to failure are the same at both temperatures. Is the alternative one or two sided? b. Find a 95% confidence interval for the difference in the mean cycles to failure for the two temperatures.arrow_forward6-30. + An article in Technometrics (1977, Vol. 19, p. 425) presented the following data on the motor fuel octane ratings of several blends of gasoline: 88.5 98.8 89.6 92.2 92.7 88.4 87.5 90.9 94.7 88.3 90.4 83.4 87.9 92.6 87.8 89.9 84.3 90.4 91.6 91.0 93.0 93.7 88.3 91.8 90.1 91.2 90.7 88.2 94.4 96.5 89.2 89.7 89.0 90.6 88.6 88.5 90.4 84.3 92.3 92.2 89.8 92.2 88.3 93.3 91.2 93.2 88.9 91.6 87.7 94.2 87.4 86.7 88.6 89.8 90.3 91.1 85.3 91.1 94.2 88.7 92.7 90.0 86.7 90.1 90.5 90.8 92.7 93.3 91.5 93.4 89.3 100.3 90.1 89.3 86.7 89.9 96.1 91.1 87.6 91.8 91.0 91.0 Construct a stem-and-leaf display for these data. Calculate the median and quartiles of these data.arrow_forward
- A cohort study is conducted to assess the association between clinical characteristics and the risk of stroke. The study involves n=1,250 participants who are free of stroke at the study start. Each participant is assessed at study start (baseline) and every year thereafter for five years. The following table displays data on hypertensive status measured at baseline and incident stroke over 5 years. Free of Stroke at 5 Years Stroke Baseline: Not Hypertensive 952 46 Baseline: Hypertensive 234 18 Compute the risk difference of stroke (per 5 person-years) for patients with hypertension as compared to patients free of hypertension.arrow_forwardA cohort study is conducted to assess the association between clinical characteristics and the risk of stroke. The study involves n=1,250 participants who are free of stroke at the study start. Each participant is assessed at study start (baseline) and every year thereafter for five years. The following table displays data on hypertensive status measured at baseline and incident stroke over 5 years. Free of Stroke at 5 Years Stroke Baseline: Not Hypertensive 952 46 Baseline: Hypertensive 234 18 Compute the population attributable risk of stroke for patients with hypertension.arrow_forward40. In a study of processes used to remove impurities from cellulose goods ("Optimization of Rope- Range Bleaching of Cellulosic Fabrics," Textile Research J., 1976: 493-496), the following data resulted from a 2 experiment involving the desiz- ing process. The four factors were enzyme concentration (A), pH (B), temperature (C), and time (D). Starch % by Weight En- Treat- zyme ment (gL) pH (C) Temp. Time 1st 2nd (hr) Repl. Repl. (1) a. b. 60.0 60.0 60.0 6. 9.80 14.04 6. 50 .75 50 .75 50 .75 50 75 50 6.0 6.0 9.72 13.50 10.13 11.27 7.0 60.0 70.0 ab 7.0 6. 11.80 11.30 6.0 6. 12.70 11.37 ac 6.0 70.0 6. 11.96 12.05 6. 11.38 9.92 70.0 70.0 60.0 60.0 60.0 60.0 70.0 70.0 70.0 70.0 be 7.0 7.0 abc. 6. 11.80 11.10 13.15 13.00 10.60 12.37 10.37 12.00 11.30 11.64 13.05 14.55 11.15 15.00 6.0 .75 ad bd abd 6.0 50 .75 7.0 7.0 6.0 6.0 7.0 7.0 cd acd 50 .75 50 8. 12.70 14.10 13.20 16.12 bcd abcd .75 a Use Yates's algorithm to obtain sums of squares and the ANOVA table. b. Do there appear to be any…arrow_forward
 MATLAB: An Introduction with ApplicationsStatisticsISBN:9781119256830Author:Amos GilatPublisher:John Wiley & Sons Inc
 Probability and Statistics for Engineering and th...StatisticsISBN:9781305251809Author:Jay L. DevorePublisher:Cengage Learning
 Statistics for The Behavioral Sciences (MindTap C...StatisticsISBN:9781305504912Author:Frederick J Gravetter, Larry B. WallnauPublisher:Cengage Learning
 Elementary Statistics: Picturing the World (7th E...StatisticsISBN:9780134683416Author:Ron Larson, Betsy FarberPublisher:PEARSON
 The Basic Practice of StatisticsStatisticsISBN:9781319042578Author:David S. Moore, William I. Notz, Michael A. FlignerPublisher:W. H. Freeman
 Introduction to the Practice of StatisticsStatisticsISBN:9781319013387Author:David S. Moore, George P. McCabe, Bruce A. CraigPublisher:W. H. Freeman