
Videos
Exercises for Section 9.2
1. The article “Organic Recycling for Soil Quality Conservation in a Sub-Tropical Plateau Region” (K. Chakrabarti, B. Sarkar, et al., J. Agronomy and Crop Science. 2000:137–142) reports an experiment in which soil specimens were treated with six different treatments, with two replicates per treatment, and the acid phosphate activity (in μmol p-nitrophenol released per gram of oven-dry soil per hour) was recorded. An ANOVA table for a one-way ANOVA follows.

The treatment means were
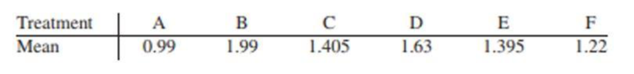
- a. Can you conclude that there are differences in acid phosphate activity among the treatments?
- b. Use the Tukey–Kramer method to determine which pairs of treatment means, if any. are different at the 5% level.
- c. Use the Bonferroni method to determine which pairs of treatment means, if any, are different at the 5% level.
- d. Which method is more powerful in this case, the Tukey–Kramer method or the Bonferroni method?
- e. The experimenter notices that treatment A had the smallest sample
mean , while treatment B had the largest. Of the Fisher LSD method, the Bonferroni method, and the Tukey-Kramer method, which, if any, can be used to test the hypothesis that these two treatment means are equal?

Trending nowThis is a popular solution!

Chapter 9 Solutions
Statistics for Engineers and Scientists
Additional Math Textbook Solutions
Basic Business Statistics, Student Value Edition (13th Edition)
Statistics Through Applications
Statistics: The Art and Science of Learning from Data (4th Edition)
Elementary Statistics Using The Ti-83/84 Plus Calculator, Books A La Carte Edition (5th Edition)
Elementary Statistics ( 3rd International Edition ) Isbn:9781260092561
Stats: Modeling the World Nasta Edition Grades 9-12


- An article in Environment International ["influence of Water Temperature and Shower Head Office Size on the release Radon During Showering" (1992, Vol. 18(4)] described an experiment in which the amount of radon released in showers was imvestigated. Radon-enriched water was used in the experiment, and six different orifice diameters were tested in shower heads. The data from the experiment are shown in the following table. 5. Orifice Diameter 0.37 0.51 0.71 1.02 Radon Released () 83 75 73 72 83 85 79 79 74 76 77 67 74 74 1.40 62 62 67 69 1.99 60 64 66 (a) Does the size of the orifice affect the mean percentage of radon released? Use a=0.05. (b) Find a 95% confidence interval on the mean percent of radon released when the orifice diameter is 1.40.arrow_forwardThe article "Effect of Refrigeration on the Potassium Bitartrate Stability and Composition of Italian Wines" (A. Versari, D. Barbanti, et al., Italian Journal of Food Science, 2002:45- 52) reports a study in which eight types of white wine had their tartaric acid concentration (in g/L) measured both before and after a cold stabilization process. The results are presented in the following table: Wine Type Before After Difference 2.86 2.59 0.27 2.85 2.47 0.38 3 1.84 1.58 0.26 4 1.60 1.56 0.04 0.80 0.78 0.02 6. 0.89 0.66 0.23 2.03 1.87 0.16 1.90 1.71 0.19 Find a 95% confidence interval for the mean difference between the tartaric acid concentrations before and after the cold stabilization process.arrow_forwardThe article “Effect of Varying Solids Concentration and Organic Loading on the Performance of Temperature Phased Anaerobic Digestion Process” (S. Vandenburgh and T. Ellis, Water Environment Research, 2002:142–148) discusses experiments to determine the effect of the solids concentration on the performance of treatment methods for wastewater sludge. In the first experiment, the concentration of solids (in g/L) was 43.94 ± 1.18. In the second experiment, which was independent of the first, the concentration was 48.66 ± 1.76. Estimate the difference in the concentration between the two experiments, and find the uncertainty in the estimate.arrow_forward
- 3.1.14 WP An article in Knee Surgery, Sports Traumatol- ogy, Arthroscopy ["Arthroscopic Meniscal Repair with an Absorbable Screw: Results and Surgical Technique" (2005, Vol. 13, pp. 273-279)] cited a success fac of more than 90% for meniscal tears with a rim width under 3 mm, but only a 67% success rate for tears of 3-6 mm. If you are unlucky enough to suffer a meniscal tear of under 3 mm on your left knee and one of width 3-6 mm on your right knee, what is the probability mass function of the number of successful surgerics? Assume that the surgeries are independent.arrow_forwardThe vulnerability of inshore environments to contamination due to urban and industrial expansion in Mombasa is discussed in the paper “Metals, Petroleum Hydrocarbons and Organo- chlorines in Inshore Sediments and Waters on Mombasa, Kenya” [Marine Pollution Bulletin (1997) 34:570–577]. A geochemical and oceanographic survey of the inshore waters of Mombasa, Kenya, was undertaken during the period from September 1995 to January 1996. In the survey, suspended particulate matter and sediment were collected from 48 stations within Mombasa’s estuarine creeks. The concentrations of major oxides and 13 trace elements were determined for a varying number of cores at each of the stations. In particular, the lead concentrations in sus-pended particulate matter (mg kg21 dry weight) were determined at 37 stations. The researchers were interested in determining whether the average lead concentration was greater than 30 mg kg21 dry weight. The data are given in the following table along with summary…arrow_forwardThe vulnerability of inshore environments to contamination due to urban and industrial expansion in Mombasa is discussed in the paper “Metals, Petroleum Hydrocarbons and Organo- chlorines in Inshore Sediments and Waters on Mombasa, Kenya” [Marine Pollution Bulletin (1997) 34:570–577]. A geochemical and oceanographic survey of the inshore waters of Mombasa, Kenya, was undertaken during the period from September 1995 to January 1996. In the survey, suspended particulate matter and sediment were collected from 48 stations within Mombasa’s estuarine creeks. The concentrations of major oxides and 13 trace elements were determined for a varying number of cores at each of the stations. In particular, the lead concentrations in sus-pended particulate matter (mg kg21 dry weight) were determined at 37 stations. The researchers were interested in determining whether the average lead concentration was greater than 30 mg kg21 dry weight. The data are given in the following table along with summary…arrow_forward
- 5.1 Byers and Williams (Viscosities of Binary and Ternary Mixtures of Polyaromatic Hydrocarbons," Journal of Chemical and Engineering Data, 32, 349 – 354, 1987) studied the impact of temperature (the regressor) on the viscosity (the response) of toluene- tetralin blends. The following table gives the data for blends with a 0.4 molar fraction of toluene. Temperature (°C) Viscosity (mPa·s) 1.133 24.9 35.0 0.9772 44.9 0.8532 55.1 0.7550 65.2 0.6723 75.2 0.6021 85.2 0.5420 95.2 0.5074 b. Fit the straight line model. Compute the summary statistics and the residual plots. What are your conclusions regarding model adequacy?arrow_forwardThe article “Effects of Diets with Whole Plant-Origin Proteins Added with Different Ratiosof Taurine:Methionine on the Growth, Macrophage Activity and Antioxidant Capacity ofRainbow Trout (Oncorhynchus mykiss) Fingerlings” (O. Hernandez, L. Hernandez, et al.,Veterinary and Animal Science, 2017:4-9) reports that a sample of 210 juvenile rainbowtrout fed a diet fortified with equal amounts of the amino acids taurine and methionine for aperiod of 70 days had a mean weight gain of 313 percent with a standard deviation of 25, while 210 fish fed with a control diet had a mean weight gain of 233 percent with a standard deviation of 19. Units are percent. Find a 99% confidence interval for the difference in weight gain on the two diets.arrow_forwardCloud seeding, a process in which chemicals such as silver iodide and frozen carbon dioxide are introduced by aircraft into clouds to promote rainfall was widely used in the 20-th century. Recent research has questioned its effectiveness [Journal of Atmospheric Research (2010, Vol. 97 (2), pp. 513-525)]. An experiment was performed by randomly assigning 52 clouds to be seeded or not. The amount of rain generated was then measured in acre-feet. Here are the data for the unseeded and seeded clouds: Unseeded: 81.2 26.1 95.0 41.1 28.6 21.7 11.5 68.5 345.5 321.2 1202.6 1.0 4.9 163.0 372.4 244.3 47.3 87.0 26.3 24.4 830.1 4.9 36.6 147.8 17.3 29.0 Seeded: 274.7 302.8 242.5 255.0 17.5 115.3 31.4 703.4 334.1 430.0 1697.8 118.3 198.6 129.6 274.7 119.0 1656.0 7.7 40.6 92.4 200.7 32.7 4.1 978.0 489.1 2745.6 Construct a frequence distribution for the combined cloud-seeding rain measurements. Use 6 bins. Class Frequency -250 < x < 250 250 < x < 750 750 < x < 1250 1250 < x < 1750 1750 < x < 2250 2250…arrow_forward
- PCBs and Pelicans. Polychlorinated biphenyls (PCBs), industrial pollutants, are known to be carcinogens and a great danger to natural ecosystems. As a result of several studies, PCB production was banned in the United States in 1979 and by the Stockholm Convention on Persistent Organic Pollutants in 2001. One study, published in 1972 by R. W. Risebrough, is titled ‘‘Effects of Environmental Pollutants Upon Animals Other Than Man’’ (Proceedings of the 6th Berkeley Symposium on Mathematics and Statistics, VI, University of California Press, pp. 443–463). In that study, 60 Anacapa pelican eggs were collected and measured for their shell thickness, in millimeters (mm), and concentration of PCBs, in parts per million (ppm). Following is a relative-frequency histogram of the PCB concentration data.arrow_forwardHere is a dataset containing plant growth measurements of plants grown in solutions of commonly-found chemicals in roadway runoff.Phragmites australis, a fast-growing non-native grass common to roadsides and disturbed wetlands of Tidewater Virginia, was grown in a greenhouse and watered with either: Distilled water (control); A weak petroleum solution (representing standard roadway runoff); Sodium chloride solution; Magnesium chloride solution; De-icing brine (50% sodium chloride and 50% magnesium chloride).Twenty grass preparations were used for each solution, and total growth (in cm) was recorded after watering every other day for 40 days.-Perform the correct statistical test to determine the p-value.-Report your answer rounded to four decimal places.-You should use formulas, functions, and the Data Analysis ToolPak in MS Excel to avoid additive rounding errors. Here are some useful functions: =t.test(array1,array2,tails,type) Produces a p-value for any…arrow_forwardInorganic phosphorous is a naturally occurring element in all plants and animals, with concentrations increasing progressively up the food chain (fruit < vegetables < cereals < nuts < corpse). Geochemical surveys take soil samples to determine phosphorous content (in ppm, parts per million). A high phosphorous content may or may not indicate an ancient burial site, food storage site, or even a garbage dump. Independent random samples from two regions gave the following phosphorous measurements (in ppm). Assume the distribution of phosphorous is mound-shaped and symmetric for these two regions Region I: x1; n1 = 15 855 1550 1230 875 1080 2330 1850 1860 2340 1080 910 1130 1450 1260 1010 Region II: x2; n2 = 14 540 810 790 1230 1770 960 1650 860 890 640 1180 1160 1050 1020 (a) Use a calculator with mean and standard deviation keys to verify that x1, s1, x2, and s2. (Round your answers to one decimal place.) x1 = ppm s1 = ppm x2 = ppm s2 = ppm…arrow_forward
 MATLAB: An Introduction with ApplicationsStatisticsISBN:9781119256830Author:Amos GilatPublisher:John Wiley & Sons Inc
 Probability and Statistics for Engineering and th...StatisticsISBN:9781305251809Author:Jay L. DevorePublisher:Cengage Learning
 Statistics for The Behavioral Sciences (MindTap C...StatisticsISBN:9781305504912Author:Frederick J Gravetter, Larry B. WallnauPublisher:Cengage Learning
 Elementary Statistics: Picturing the World (7th E...StatisticsISBN:9780134683416Author:Ron Larson, Betsy FarberPublisher:PEARSON
 The Basic Practice of StatisticsStatisticsISBN:9781319042578Author:David S. Moore, William I. Notz, Michael A. FlignerPublisher:W. H. Freeman
 Introduction to the Practice of StatisticsStatisticsISBN:9781319013387Author:David S. Moore, George P. McCabe, Bruce A. CraigPublisher:W. H. Freeman