
Videos
Recycling newsprint is important in reducing waste. The article “The Influence of Newspaper Aging on Optical Properties of its De-inked Pulp” (M. Rahmaninia, A Latibari, ct al., Turkish J Eng Env-Set, 2008:35–39) presents the results of an experiment to determine the effects of the age of newsprint on the brightness (in percent) of the recycled paper. Four aging periods were considered, along with five concentrations of sodium hydroxide (NaOH), used to de-ink the paper. The effect of the sodium hydroxide concentration is not of interest. The results are presented in the following table.
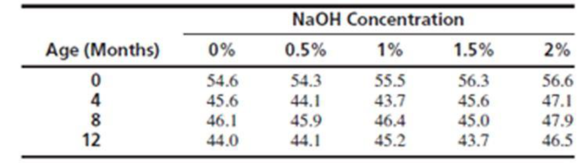
- a. Identify the blocking factor and the treatment factor.
- b. Construct an ANOVA table. You may give
ranges for the P-values. - c. Can you conclude that brightness differs with age? Explain.
- d. Which pairs of ages, if any, can you conclude to have differing brightnesses? Use the 5% level.
Want to see the full answer?
Check out a sample textbook solution
Chapter 9 Solutions
Statistics for Engineers and Scientists
Additional Math Textbook Solutions
Basic Business Statistics, Student Value Edition (13th Edition)
Elementary Statistics Using Excel (6th Edition)
Introductory Statistics
Business Analytics
Elementary Statistics: Picturing the World (6th Edition)


- Body Fat. In the paper “Total Body Composition by Dual- Photon (153 Gd) Absorptiometry” (American Journal of Clinical Nutrition, Vol. 40, pp. 834–839), R. Mazess et al. studied methods for quantifying body composition. Eighteen randomly selected adults were measured for percentage of body fat, using dual-photon absorptiometry. Each adult’s age and percentage of body fat are shown on the WeissStats site. a. Decide whether finding a regression line for the data is reasonable. If so, then also do parts (b)–(d). b. Obtain the coefficient of determination. c. Determine the percentage of variation in the observed values of the response variable explained by the regression, and interpret your answer. d. State how useful the regression equation appears to be for making predictions.arrow_forwardThe article “Effect of Varying Solids Concentration and Organic Loading on the Performance of Temperature Phased Anaerobic Digestion Process” (S. Vandenburgh and T. Ellis, Water Environment Research, 2002:142–148) discusses experiments to determine the effect of the solids concentration on the performance of treatment methods for wastewater sludge. In the first experiment, the concentration of solids (in g/L) was 43.94 ± 1.18. In the second experiment, which was independent of the first, the concentration was 48.66 ± 1.76. Estimate the difference in the concentration between the two experiments, and find the uncertainty in the estimate.arrow_forwardAn article in Environment International ["influence of Water Temperature and Shower Head Office Size on the release Radon During Showering" (1992, Vol. 18(4)] described an experiment in which the amount of radon released in showers was imvestigated. Radon-enriched water was used in the experiment, and six different orifice diameters were tested in shower heads. The data from the experiment are shown in the following table. 5. Orifice Diameter 0.37 0.51 0.71 1.02 Radon Released () 83 75 73 72 83 85 79 79 74 76 77 67 74 74 1.40 62 62 67 69 1.99 60 64 66 (a) Does the size of the orifice affect the mean percentage of radon released? Use a=0.05. (b) Find a 95% confidence interval on the mean percent of radon released when the orifice diameter is 1.40.arrow_forward
- 1.“Effects of Short-Term Supplementation with Selenised Yeast on Milk Production and Composition of Lactating Cows”(Australian Journal of Dairy Technology, [2004]: 199-203) supplied the following data on milk selenium concentration (mg/L) for a sample of cows given seleniumsupplement (the treatment group) and a sample of cows given no supplement (the control group). The measurements of selenium were taken initally and again after a 9-day period. The study was conducted becausea deficiency of the trace element selenium in the diet can negatively impact growth, immunity, muscle and neuromuscular function, and fertility. The production of selenium supplements to dairy cows is justified when pastures have low selenium levels. data is attached a.Use the given data for the treatment group to determine if there is sufficient evidenceto conclude that the mean selenium concentration is greater after 9 days of the selenium supplement. b.Are the data for the cows in…arrow_forwardThe article “Effects of Diets with Whole Plant-Origin Proteins Added with Different Ratiosof Taurine:Methionine on the Growth, Macrophage Activity and Antioxidant Capacity ofRainbow Trout (Oncorhynchus mykiss) Fingerlings” (O. Hernandez, L. Hernandez, et al.,Veterinary and Animal Science, 2017:4-9) reports that a sample of 210 juvenile rainbowtrout fed a diet fortified with equal amounts of the amino acids taurine and methionine for aperiod of 70 days had a mean weight gain of 313 percent with a standard deviation of 25, while 210 fish fed with a control diet had a mean weight gain of 233 percent with a standard deviation of 19. Units are percent. Find a 99% confidence interval for the difference in weight gain on the two diets.arrow_forwardThe article "Determination of Carboxyhemoglobin Levels and Health Effects on Officers Working at the Istanbul Bosphorus Bridge" (G. Kocasoy and H. Yalin, Journal of Environmental Science and Health, 2004:1129–1139) presents assessments of health outcomes of people working in an environment with high levels of carbon monoxide (CO). Following are the numbers of workers reporting various symptoms, categorized by work shift. The numbers were read from a graph. Shift Morning Evening Night Influenza 16 13 18 Headache 24 33 Weakness 11 16 5 Shortness of Breath Can you conclude that the proportions of workers with the various symptoms differ among the shifts?arrow_forward
- The article "Effect of Environmental Factors on Steel Plate CoIrosion Under Marine Immersion Conditions" (C. Soares, Y. Garbatov, and A. Zayed, Corrosion Engineering, Science and Technology, 2011:524-541) descrībes an experiment in which nine steel specimens were submerged in seawater at various temperatures, and the corrosion rates were measured. The results are presented in the following table (obtained by digitizing a graph). Temperature (*C) Corrosion (mnm/yr) 26.6 1.58 26.0 1.45 27.4 1.13 21.7 0.96 14.9 0.99 11.3 1.05 15.0 0.82 8.7 0.68 8.2 0.56 Construct a scatterplot of corosion (y) versus temperature (x). Verify that a linear model is appropriate. Compute the least-squares line for predicting corrosion from temperature. Two steel specimens whose temperatures differ by 10°C are submerged in seawater. By how much would you predict their corrosion rates to differ? Predict the corrosion rate for steel submerged in seawater at a temperature of 20°C. Compute the fitted values.…arrow_forwardThe article “The Effect of Restricting Opening Hours on Alcohol-Related Violence” (S. Duailibi, W. Ponicki, et al., American Journal of Public Health, 2007:2276–2280) presented homicide rates for the years 1995–2005 for the town of Diadema, Brazil. In 2002, a law was passed requiring bars to close at 11 pm each night. After the law's passage, the homicide rate dropped by an average of 9 homicides per month, a statistically significant decrease. Which of the following is the best conclusion? a) It is reasonable to conclude that the law is responsible for a reduction of 9 homicides per month. b) It is reasonable to conclude that the law is responsible for a reduction in homicides, but the actual amount might be somewhat more or less than 9 per month. c) It is reasonable to conclude that the homicide rate decreased, but the law may not have anything to do with the decrease. d) It is plausible that the homicide rate may not have decreased at all after the passage of the law.arrow_forwardThe article “Arsenic and Mercury in Lake Whitefish and Burbot Near the Abandoned Giant Mine on Great Slave Lake” (P. Cott, B. Zajdlik, et al., Journal of Great Lakes Research, 2016:223–232) presents measurements of arsenic concentrations in fish found in Northern Canada. In a sample of 8 whitefish caught in Yellowknife Bay, the mean arsenic concentration in the liver was 0.32 mg/kg, with a standard deviation of 0.05 mg/kg. Can you conclude that the mean arsenic concentration in whitefish in Yellowknife Bay is greater than 0.3 mg/kg?arrow_forward
- The Lion’sMane. In a study by P. M.West titled “The Lion’s Mane” (American Scientist, Vol. 93, No. 3, pp. 226–236), the effects of the mane of a male lion as a signal of quality to mates and rivals was explored. Four life-sized dummies of male lions provided a tool for testing female response to the unfamiliar lions whose manes varied by length (long or short) and color (blonde or dark). The female lions were observed to see whether they approached each of the four life-sized dummies. a. experimental units. b. response variable. c. factor(s). d. levels of each factor. e. treatments.arrow_forwardToxic Mushrooms? Cadmium, a heavy metal, is toxic to animals. Mushrooms, however, are able to absorb and accumulate cadmium at high concentrations. The Czech and Slovak governments have set a safety limit for cadmium in dry vegetables at 0.5 part per million (ppm). M. Melgar et al. measured the cadmium levels in a random sample of the edible mushroom Boletus pinicola and published the results in the paper “Influence of Some Factors in Toxicity and Accumulation of Cd from Edible Wild Macrofungi in NW Spain” (Journal of Environmental Science and Health, Vol. B33(4), pp. 439–455). A hypothesis test is to be performed to decide whether the mean cadmium level in Boletus pinicola mushrooms is greater than the government’s recommended limit. a. determine the null hypothesis. b. determine the alternative hypothesis. c. classify the hypothesis test as two tailed, left tailed, or right tailed.arrow_forwardCadmium, a heavy metal, is toxic to animals. Mushrooms, however, are able to absorb and accumulate cadmium at high concentrations. The Czech and Slovak governments have set a safety limit for cadmium in dry vegetables at 0.5 part per million (ppm). M. Melgar et al. measured the cadmium levels in a random sample of the edible mushroom Boletus pinicola and published the results in the paper “Influence of Some Factors in Toxicity and Accumulation of Cd from Edible Wild Macrofungi in NW Spain” (Journal of Environmental Science and Health, Vol. B33(4), pp. 439–455). A hypothesis test is to be performed to decide whether the mean cadmium level in Boletus pinicola mushrooms is greater than the government’s recommended limit. Hypothesis tests are proposed. For each hypothesis test,a. determine the null hypothesis.b. determine the alternative hypothesis.c. classify the hypothesis test as two tailed, left tailed, or right tailed.arrow_forward
 MATLAB: An Introduction with ApplicationsStatisticsISBN:9781119256830Author:Amos GilatPublisher:John Wiley & Sons Inc
 Probability and Statistics for Engineering and th...StatisticsISBN:9781305251809Author:Jay L. DevorePublisher:Cengage Learning
 Statistics for The Behavioral Sciences (MindTap C...StatisticsISBN:9781305504912Author:Frederick J Gravetter, Larry B. WallnauPublisher:Cengage Learning
 Elementary Statistics: Picturing the World (7th E...StatisticsISBN:9780134683416Author:Ron Larson, Betsy FarberPublisher:PEARSON
 The Basic Practice of StatisticsStatisticsISBN:9781319042578Author:David S. Moore, William I. Notz, Michael A. FlignerPublisher:W. H. Freeman
 Introduction to the Practice of StatisticsStatisticsISBN:9781319013387Author:David S. Moore, George P. McCabe, Bruce A. CraigPublisher:W. H. Freeman